Testimony Before the U.S. Senate Homeland Security Committee

Editor’s note: Brian Riedl testified before the U.S. Senate Committee on Homeland Security and Governmental Affairs in a hearing entitled “Examining the Root Causes of America’s Unsustainable Fiscal Path.” Watch video of the hearing on the Committee website, written testimony can be found below.
Good morning Chairman Johnson, Ranking Member Peters, and Members of the Committee. Thank you for inviting me to participate in today’s hearing.
My name is Brian Riedl. I am a Senior Fellow in Budget, Tax, & Economic Policy at the Manhattan Institute for Policy Research. The views I express in this testimony are my own, and should not be construed as representing any official position of The Manhattan Institute.
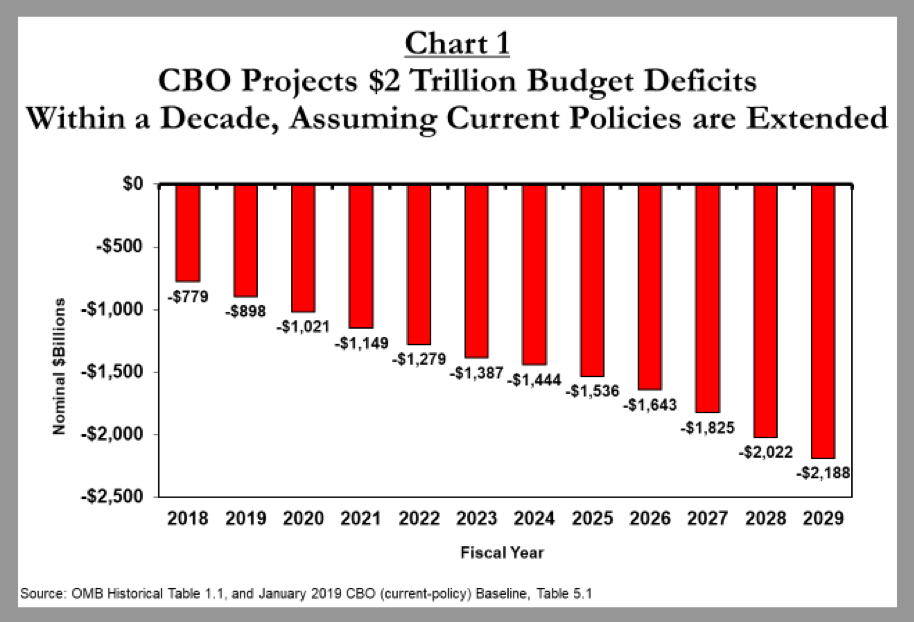
Few Americans fully comprehend the fiscal avalanche that has begun. The budget deficit should surpass $1 trillion as soon as next year – on its way to $2 trillion within a decade if current policies continue. And if interest rates merely rise back to 1990s levels, that would push the projected annual budget deficit to $3 trillion in ten years. This is according to data from the Congressional Budget Office.
Over the next 30 years, Social Security and Medicare face a combined $103 trillion cash deficit, which will push the national debt to nearly 150% of GDP. At that point, interest on that debt would consume 40% of all tax revenues (or more if interest rates rise). Unless reforms are enacted, global markets will, at some point, stop lending to the U.S. at plausible interest rates. When that event occurs, or even approaches, interest rates will soar, and the federal government will not be able to pay its bills, with dire consequences for the U.S. economy.
I. Drivers of the Rising Ten-Year Budget Deficit
CBO’s current-policy baseline – which adjusts for the costs of extending the 2017 tax cuts, delayed ACA health taxes, annual tax extenders, and the recent increase in the discretionary spending caps – assumes that the budget deficit will leap $898 billion to $2,188 billion over the next decade (see chart 1), with a total ten-year deficit of $15.5 trillion.1
A portion of the underlying deficit is driven by the $250 billion annual cost of the recent tax cuts, and the $150 billion annual cost of the higher discretionary spending caps. However, that combined $400 billion to $500 billion cost will remain relatively steady if extended. It does not explain the $1.3 trillion rise in projected red ink over the next decade (chart 2).
Instead, nearly the entire surge in red ink will come from adding 74 million baby boomers to the Social Security and Medicare systems. This is both a result of demographics, and rising health costs.
Social Security and Medicare are not fully self-financed through premiums, payroll taxes, and related dedicated taxes. Each system requires an annual general revenue transfer to pay all promised benefits (some of these transfers are credited as interest payments to trust funds). And these transfers – as well as the interest costs of the Treasury borrowing to cover these transfers – are about to soar.
The cost of filling Social Security and Medicare’s annual shortfalls (and the resulting interest costs) will jump from $440 billion to $1,656 billion between 2019 and 2029. These $1.2 trillion in additional general revenue transfers (and interest) will account for 90% of the $1.3 trillion projected rise in the annual deficit over the next decade.
In total, over the next ten years, Social Security will receive a general revenue transfer of $2.5 trillion, and Medicare will receive a general revenue transfer of $5.9 trillion. Given the percentage of federal spending that must be deficit-financed, these general revenue costs will add $1.8 trillion in net interest costs. Thus, the Social Security and Medicare systems will drain the general revenues by $10.2 trillion over the next decade. The rest of the budget deficit will total $1.8 trillion (1% of GDP) under a current-law baseline, or $5.3 trillion (2% of GDP) if current policies are extended.
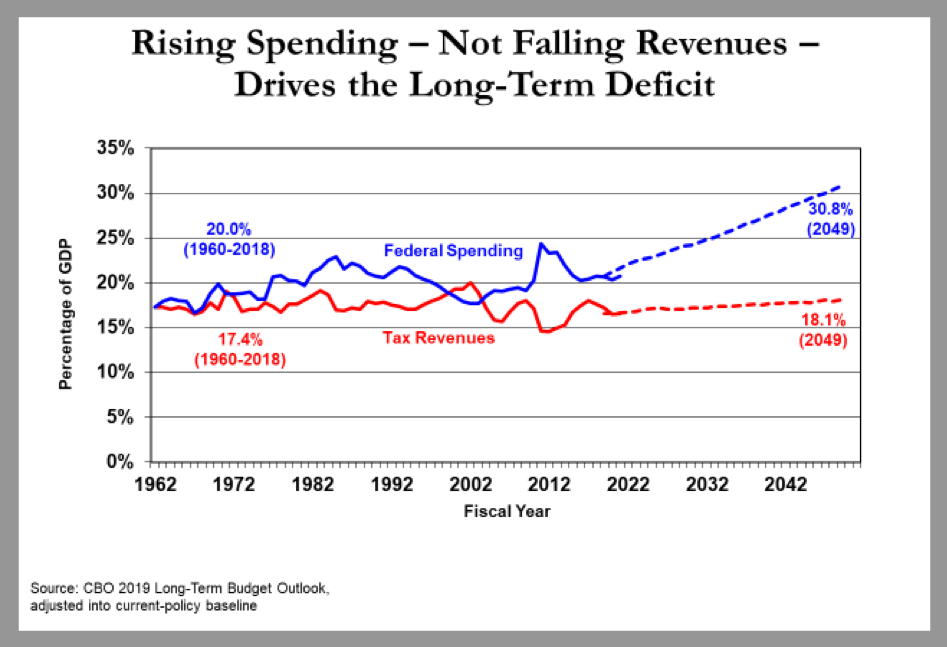
Social Security has “earned” these deficits through all the prior surpluses that it had returned to the Treasury before 2009. And the Medicare system’s deficits are by program design. Nevertheless, these rapidly rising deficits are the main moving variable driving future deficits upward. The rest of federal spending (excluding interest) is projected to steadily decline indefinitely as a share of the economy. Revenues are projected by CBO to dip as share of the GDP, but then gradually rise past the 17.4% of GDP average that prevailed before the tax cuts (even if the tax cuts are extended).

II. Why the Long-Term Debt Is Soaring
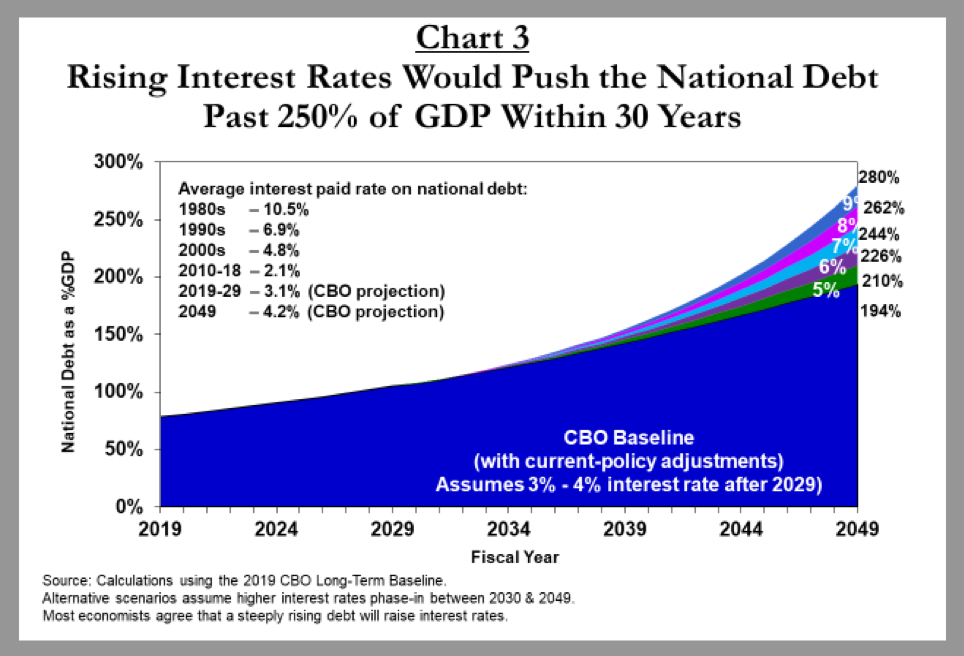
From the mid-1950s through 2008, the national debt held by the public averaged 35% of GDP.2 This level of borrowing could easily be absorbed by the increasingly global financial markets, and it resulted in interest costs averaging 2% of GDP (roughly 10% of a typical federal budget). Since 2008, the great recession and the beginning of the baby-boomer retirements have more than doubled the debt, to 78% of GDP. If current policies continue, the debt is projected to reach an unprecedented 194% of GDP within 30 years.3 And if this debt brings higher interest rates (as consensus economic theory suggests),4 the debt could surpass 250% of GDP (chart 3) and servicing the debt could cost 7.6% of GDP—the equivalent of $1.7 trillion in today’s economy. Americans of all incomes would face unprecedented tax increases; higher interest rates for home mortgages and car, student, and business loans; and a significant economic slowdown. Unlike Greece’s, the U.S. debt would be too large to be easily absorbed by the global economy.
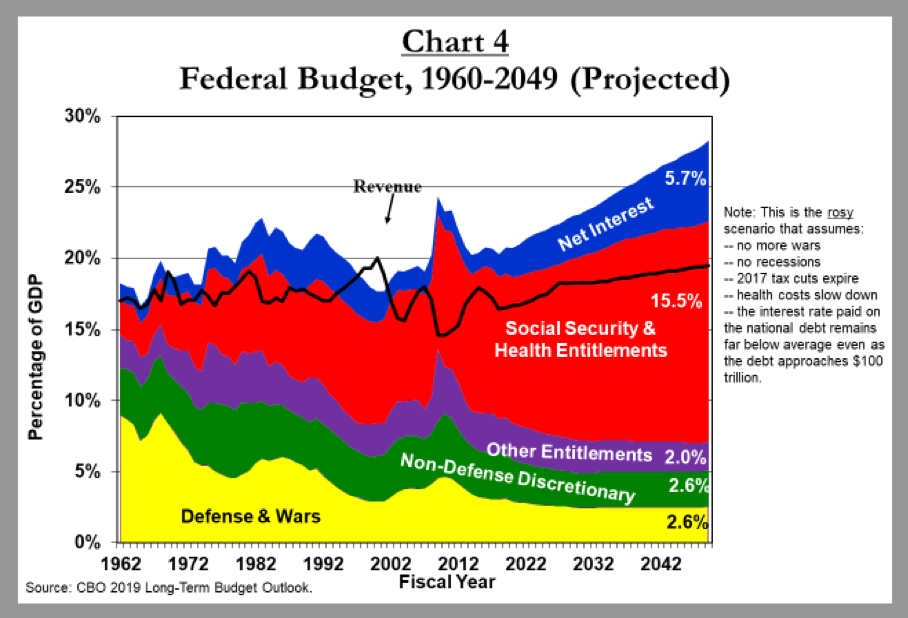
What is causing the debt rise? Not inadequate tax revenues—which, since the early 1950s, have usually remained between 16.5% and 18.5% of GDP, regardless of tax policies, and which are projected to rise above historical norms, to 18.1%–19.5% of GDP, depending on the fate of various expiring tax cuts and delayed tax increases.5 Nor is it driven, on the spending side, by aggregate expenditures for discretionary and smaller entitlements, which are projected to continue falling as a share of the economy.
Chart 4 shows that the entire increase in long-term debt will come from surging Social Security, Medicare, and other government health-care spending. According to the Congressional Budget Office (CBO), these costs have risen from 7% to 10% of GDP since 2000 and are projected to reach 15.5% of GDP by 2049—or 21.2% of GDP when the interest cost of Social Security and Medicare’s annual deficits are included.
Why Social Security and Medicare Are Driving Budget Deficits
Between 2008 and 2030, 74 million Americans born between 1946 and 1964—on average, 10,000 per day—will retire and receive Social Security and Medicare benefits. Of this group, those retiring at age 66 and living to age 90 will spend one-third of their adult life receiving federal retirement benefits. The combination of more retiring baby boomers and longer life spans will expand Social Security and Medicare caseloads far beyond what current taxpayers can afford under current benefit formulas. In 1960, five workers paid the taxes to support each retiree (and, of course, Medicare did not exist). The ratio of workers to retirees has now fallen below 3–1, on its way to 2–1 by the 2030s. At that point, each married couple will basically be responsible for the Social Security and health care of their very own retiree.
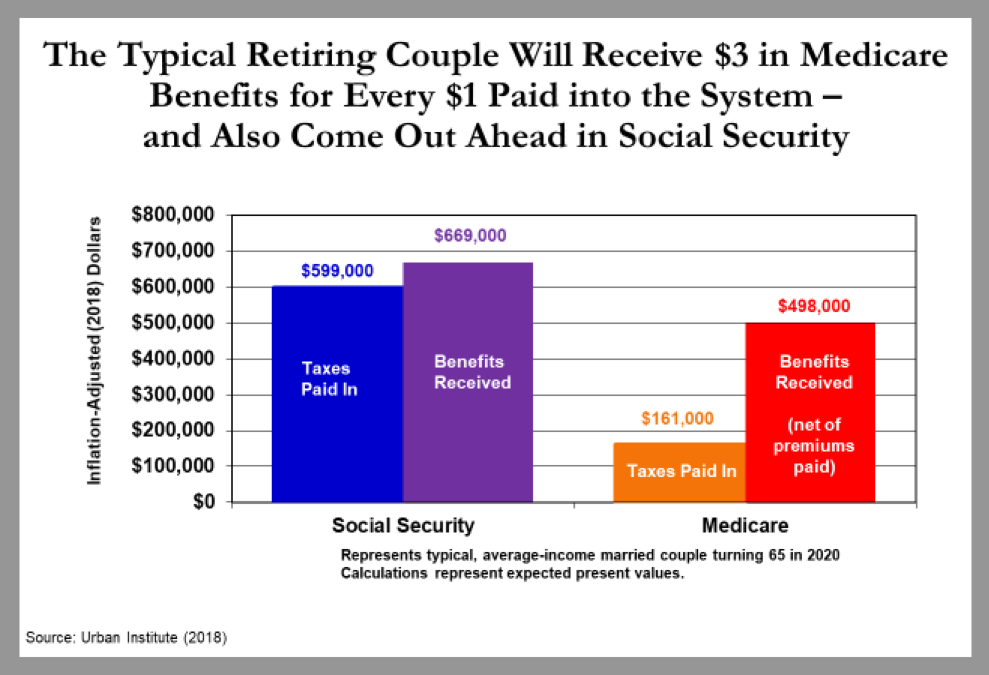
These demographic challenges are worsened by rising health-care costs and repeated benefit expansions enacted by lawmakers. Today’s typical retiring couple has paid $161,000 into Medicare and will receive $498,000 in benefits (in net present value), in part because Medicare’s physician and drug benefits are not pre-funded with payroll taxes, and only partially funded by retiree premiums. Most Social Security recipients also come out ahead.6 Thus, most seniors’ benefits greatly exceed their lifetime contributions to the Social Security and Medicare systems. By 2030, the 74 million baby boomers will have joined a retirement benefit system that runs a substantial per-person deficit.
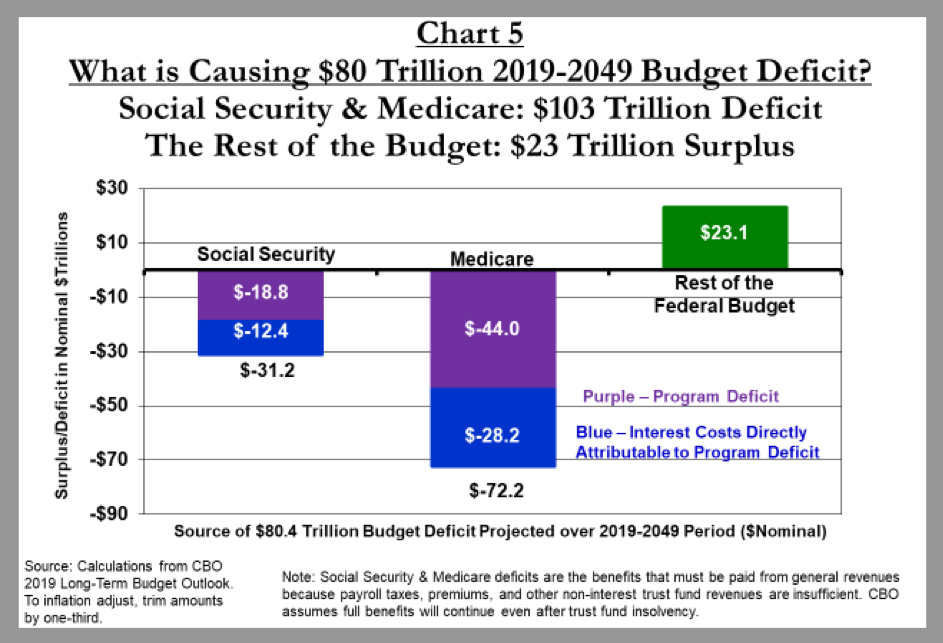
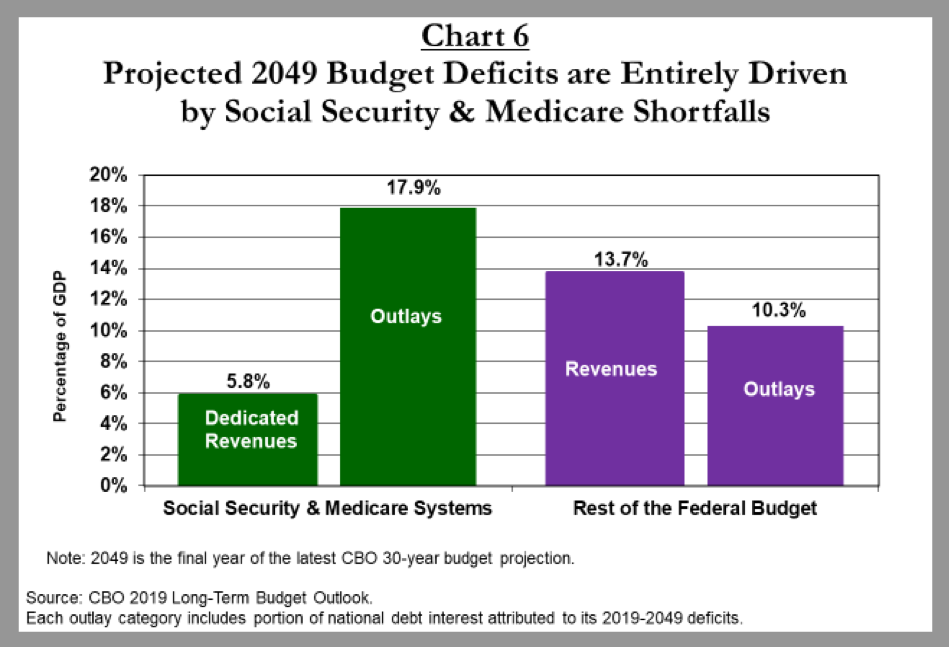
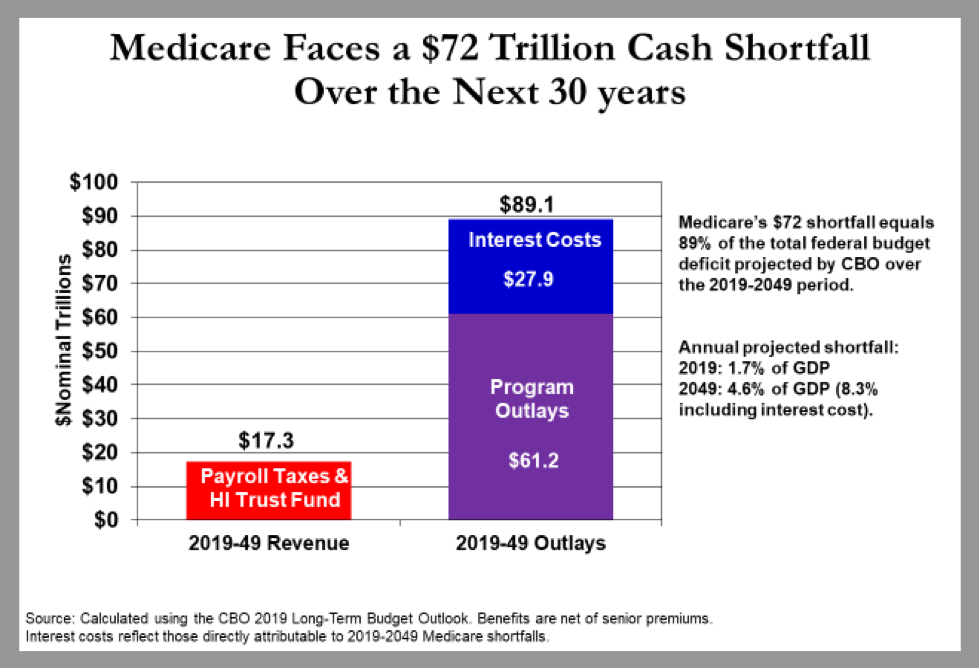
Chart 5 shows that, according to CBO data, between 2019 and 2049:
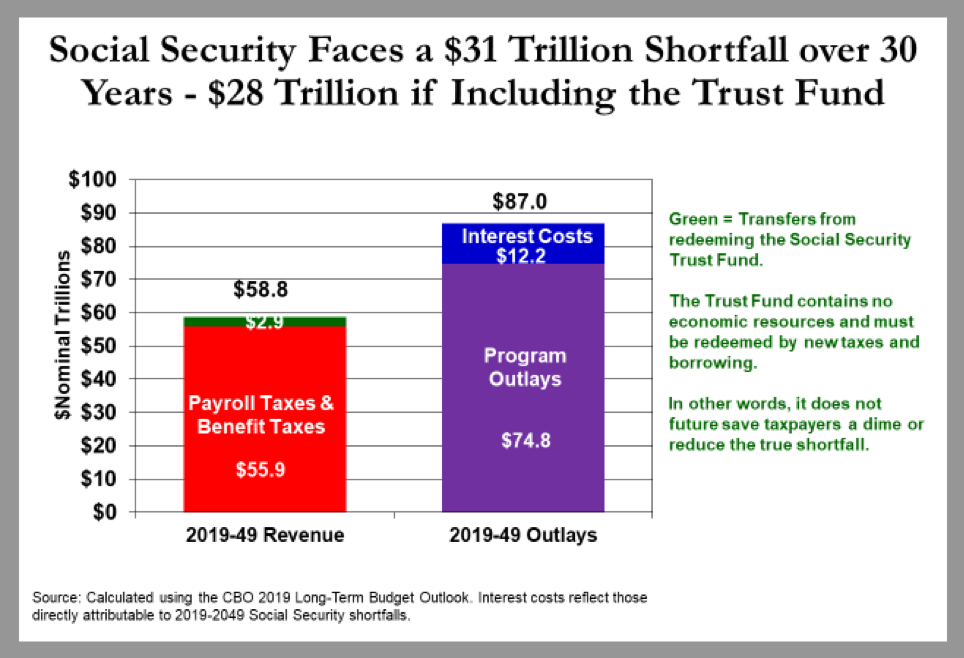
- Social Security will run a $19 trillion cash deficit (collecting $56 trillion, spending $75 trillion).
- Medicare will run a $44 trillion cash deficit (collecting $17 trillion, spending $61 trillion).
- These shortfalls are directly responsible for $40 trillion of the coming interest costs on the debt.7
(To adjust these 30-year totals for inflation, trim by one-third.)
Rather than self-finance through payroll taxes and premiums, these two programs are set to add $103 trillion to the debt. The rest of the federal budget is projected to run a surplus over the next 30 years.
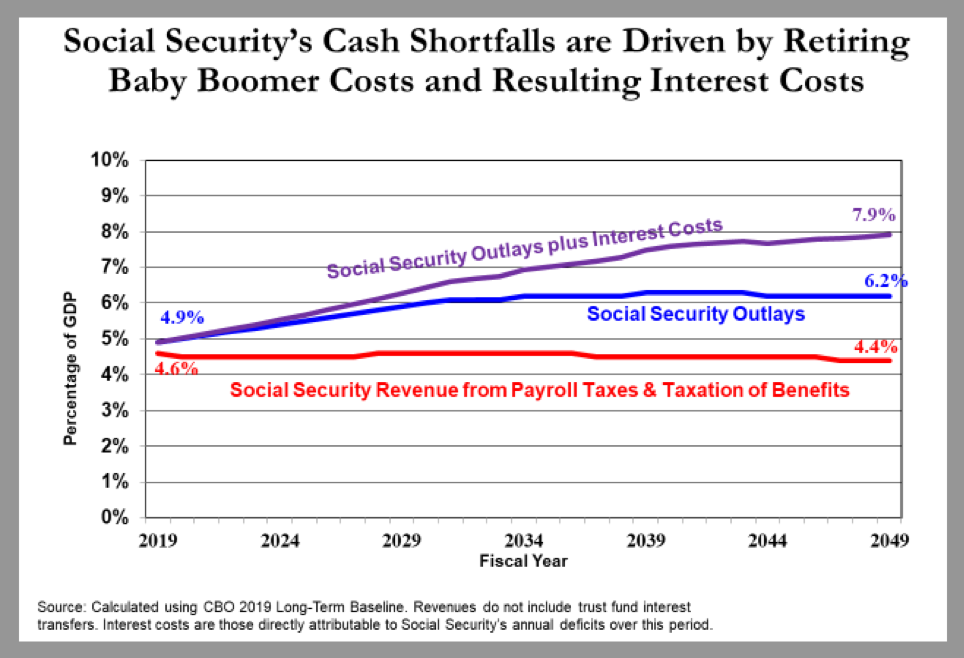
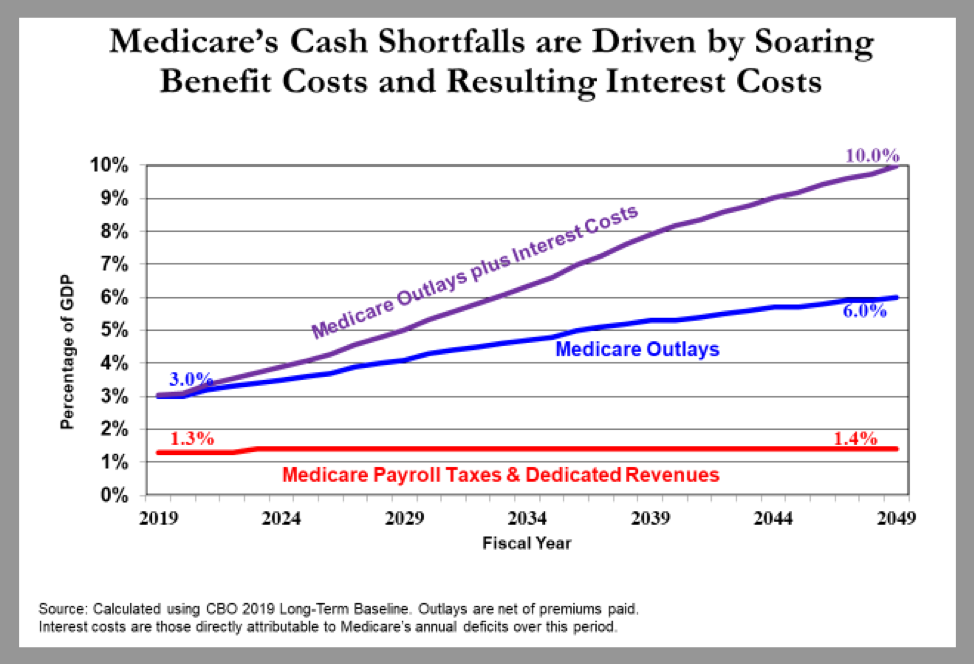
Between 2019 and 2049, the annual Social Security and Medicare deficits are projected to rise from 2.0% to 12.1% of GDP. This projected 2049 shortfall will consist of Medicare (4.6% of GDP), Social Security (1.8%), and the interest costs directly attributed to these program shortfalls (5.7%). The rest of the budget will run a 3.4% of GDP surplus, according to CBO data (see chart 6).8
The Fiscal Avalanche Has Already Begun
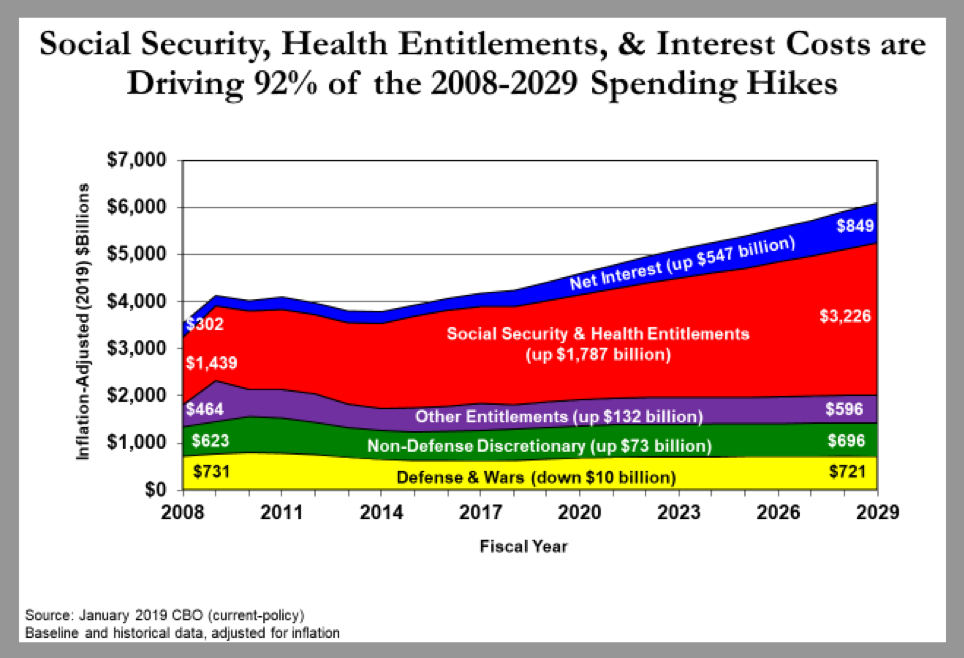
Since 2008—when the first baby boomers qualified for early retirement—Social Security and Medicare have accounted for 60% of all inflation-adjusted federal spending growth (with Medicaid and the Affordable Care Act responsible for an additional 31%). The majority of budgetary savings achieved by discretionary spending caps, defense cuts, and rising tax revenues have simply financed growing Social Security and Medicare costs, which will grow by another $130 billion annually over the next decade.9 That is the equivalent of creating another Defense Department every five years. This will happen automatically, without any congressional votes and therefore likely with scant media coverage.
And as federal resources further shift to the elderly, Washington is beginning to run out of offsetting spending cuts. This has contributed to the deficit expanding from $438 billion to $666 billion through 2017, even before the recent tax cuts. CBO’s current-policy baseline shows deficits rising to $2 trillion within a decade—or $3 trillion, if interest rates return to historical norms. Unlike the temporary, recession-driven budget deficits a decade ago, these Social Security– and Medicare-based deficits will expand permanently. Over the next 30 years, CBO projects that the national debt will grow from $22 trillion to $103 trillion ($56 trillion after inflation)—or much higher, if interest rates rise from the projected 3%–4% range to the historically typical 5%–6%.
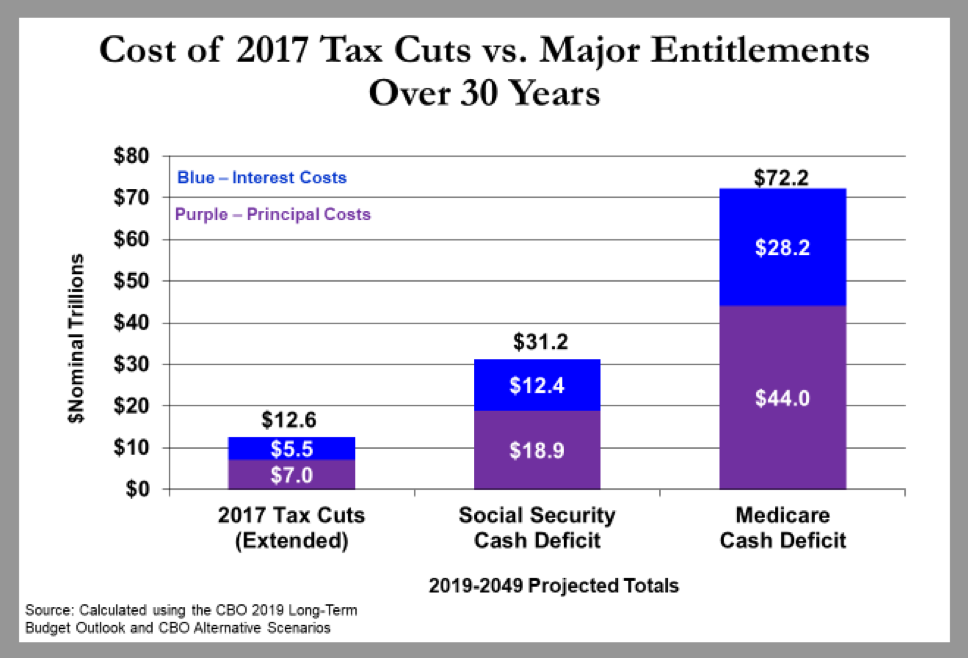
Predictably, most of the popular blame for the rising deficits is currently pinned on the 2017 Tax Cuts and Jobs Act (TCJA). TCJA will likely decrease revenues by roughly 1% of GDP indefinitely if extended past 2025, when parts of the law are currently scheduled to expire.10 (This does not include additional tax revenues that will arise from economic growth that lower tax rates will induce. The congressional Joint Committee on Taxation estimates that these additional tax revenues would offset the additional interest costs of the tax law, though not the primary deficit-increasing impact of the tax cuts themselves.) While the government revenues forgone by TCJA will surely worsen deficits, they are a much smaller contributor than Social Security, Medicare, and Medicaid, spending on which will together rise by 2.6% of GDP over the decade and 5.7% over 30 years.11 Even without the 2017 tax cuts, the annual deficit would still exceed $1.9 trillion within a decade. In short, TCJA did not create the federal government’s large deficits, and even repealing them would not absolve lawmakers of the need to address rising entitlement spending.
III. The Mirage of “Easy” Solutions
Real deficit reduction will involve a real burden. Yet standing in the reform is series of false claims that the problem is easily solved.
Economic Panaceas
Steep economic growth. A strong economy is necessary but far from sufficient for major deficit reduction. Growth rates will already be limited by the labor-force slowdown caused by baby-boomer retirements and declining birthrates. That leaves productivity to drive growth.
So, no problem? Let’s start by disregarding CBO’s 2019 projection that total U.S. factor productivity will continue growing at the 1.1% average rate of the past 30 years and instead assume the white-hot 1.8% rate that prevailed from 1992 through 2005.12 Most economists13 would consider this rate far too optimistic.14 Nevertheless, the resulting higher incomes and tax revenues from this productivity jet stream would seem to close at least 40% of the cumulative deficits through 2049—until one accounts for the fact that higher incomes automatically result in higher Social Security benefits when the workers who earned them retire.
Much can be done to increase real economic growth rates above CBO’s long-term 1.9% annual projections. In particular, lawmakers should aim to grow the labor-force participation rate; continue to refine the tax code to encourage work, savings, and investment; and improve policies in the areas of trade, energy, job training, education, and health care. However, a refusal to address surging spending and deficits would still undermine economic growth by raising interest rates, decreasing business investment, and ultimately forcing up taxes. Lawmakers should aspire to faster growth but not simply assume it—especially if entitlement costs keep growing.
Inflate the debt away. In the short term, higher inflation can dilute some of today’s $22 trillion national debt. However, Social Security and Medicare benefits and payments are also tied to inflation, so future liabilities would expand. Additionally, Washington would have to pay much higher interest rates when borrowing to finance those benefits.
Low interest rates. CBO’s 2019 Long-Term Budget Outlook assumes that the national debt can rise from 35% to 144% of GDP between 2007 and 2049, with its average interest rate peaking at just 4.2%—which is below even the levels of the 1990s (6.9%) and 2000s (4.8%). By contrast, the economic-policy community consensus is that such a large increase in federal debt would raise interest rates.15 For each percentage point that interest rates rise, Washington must pay approximately $11 trillion more in interest costs over 30 years.16 That means an even higher national debt.
Immigration. Smart immigration policy may, on net, marginally improve the federal budget picture (and the economy). It is not a cure-all. High-skill immigrants send higher tax revenues during their working careers, but their eventual retirement into Social Security and Medicare would add new liabilities to the system. Low-skill immigrants generally increase costs to the federal government (and especially to state and local governments)—at least, in the first or second generation, because the resulting education, infrastructure, and social spending exceed the added tax revenues.17
Conservative Fantasies
Pro-growth tax policy. Economic growth is obviously important to deficit reduction—and tax legislation that depresses savings and investment must be avoided. Nevertheless, the historical record clearly shows that the vast majority of tax cuts do not increase tax revenues—especially by enough to keep pace with federal programs growing 6%–7% annually.18
Eliminating welfare and lower-priority spending. Over the past 15 years, congressional GOP blueprints have typically imposed nearly all the first decade’s cuts on antipoverty programs (Medicaid, ACA subsidies, SNAP [aka food stamps], and others) as well as nondefense discretionary spending, such as education, veterans’ health, homeland security, medical research, and infrastructure. This pot of spending—7% of GDP and declining—would have to be mostly eliminated to balance the budget a decade from now.19 These cuts will never be passed by any Congress, as their advocates on Capitol Hill and in top think tanks surely know. While there are any number of failed and unnecessary programs in need of major reform, proposals to eviscerate these entire categories of spending while letting Social Security and Medicare off the hook are a politically delusional distraction.
Impossibly tight spending caps. Spending caps are a vital tool to enforce realistic spending targets. But absent any achievable underlying programmatic reforms to meet those targets, they are an empty gimmick. Nevertheless, many conservative budget blueprints simply divide the federal budget into five to eight spending categories and then assume unprecedented cuts in targeted categories, with no underlying policy proposals to achieve those targets. For instance, President Trump’s budgets have assumed a 60% reduction in total nondefense discretionary spending as a percentage of GDP over the decade without specifying which specific programs would be slashed, and how they would operate once all cuts are enacted.20 The 2011 Budget Control Act has shown that overly tight caps will be canceled rather than force politically suicidal cuts.
Devolution to state governments. There is a strong policy case for allowing states to have more control over poverty relief, education, infrastructure, economic development, and law-enforcement spending. However, counting the federal savings from devolution as the centerpiece of a deficit-reduction strategy is disingenuous because it simply shifts the deficits and taxes to the state level (minus modest efficiency gains that might come from better state fiscal management). The purpose of deficit reduction is to limit government borrowing and tax increases (and to limit economic damage), not merely to change the address where the taxes are sent.
Liberal Fantasies
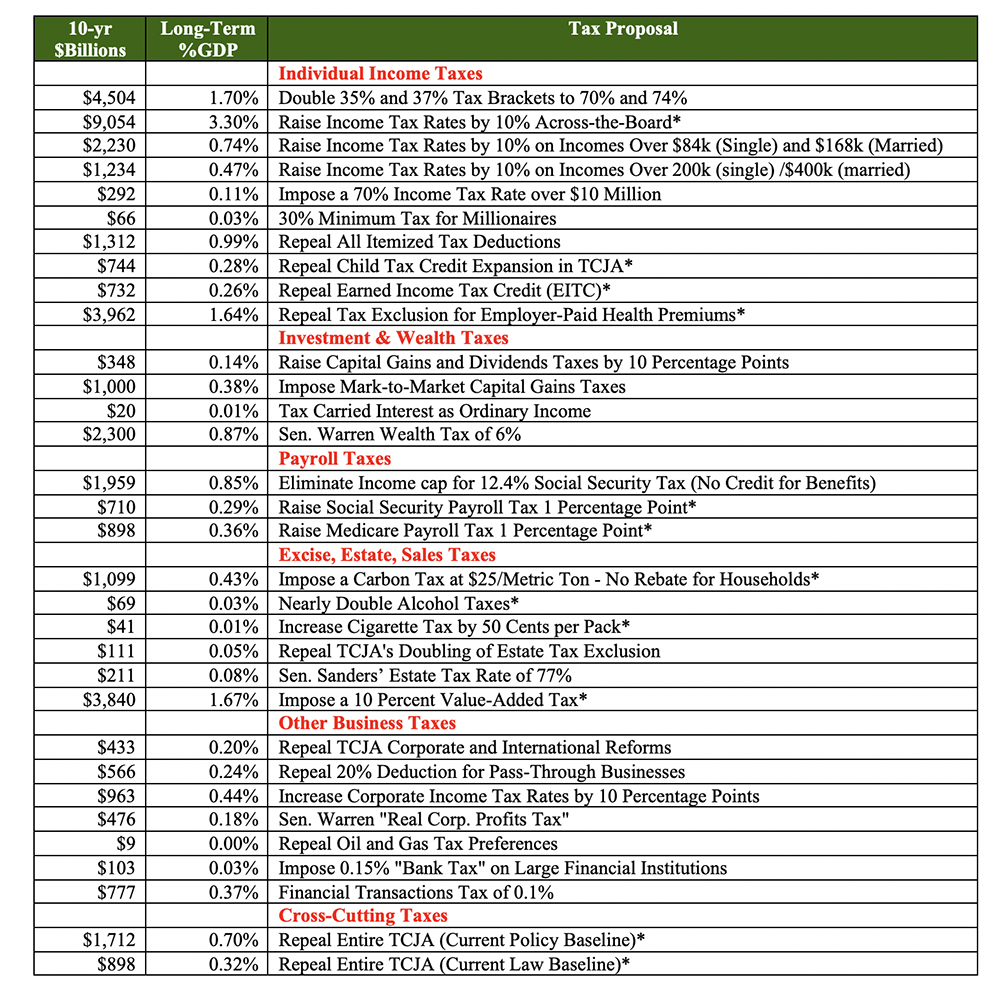
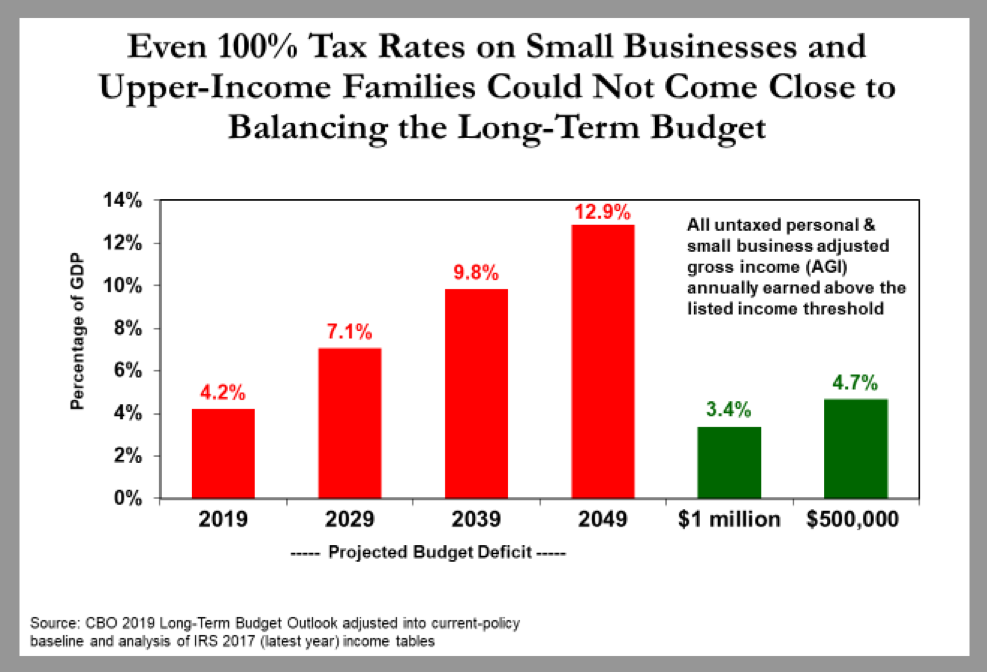
“Just tax the rich.” Liberal advocates often vastly overstate the degree to which upper-income tax increases can finance the ever-expanding government. In the first place, the U.S. already has the most progressive tax code in the OECD—even adjusting for differences in income inequality.21 And setting aside the moral questions that would be raised by the government seizing the vast majority of any family’s income, basic math shows that large tax increases on high-income Americans cannot close most of the long-term budget deficit.
How much revenue is needed? Forget balancing the budget, simply stabilizing the debt at 95% of GDP (with annual deficits of 3% of GDO) would require a combination of tax increases and spending cuts that eventually adds up to 6% of GDP. Chart 7 shows the difficulty of building a tax increase of this size. Even a 100% tax rate on all income over $500,000 would raise just 4.7% of GDP (until those affected stop working and investing).22 Alternatively, doubling the top 35% and 37% tax brackets, to 70% and 74% would raise only approximately 1.7% of GDP—and even that figure ignores all revenues lost to the economic effects of 85% marginal tax rates (when including state and payroll taxes) on work or investment, as well as tax avoidance and evasion. A 6% wealth tax – far exceeding the mostly-abandoned rates of Europe – would raise less than 1% of GD).
If America wants to spend like Europe, it must also tax like Europe. This means, in addition to federal and state income taxes, a European value-added tax (VAT)—essentially a national sales tax—that affects all families. The most realistic way to raise 6% of GDP in revenues is by either:
- Imposing a VAT that rises to 36%; or
- Raising the payroll tax from 15.3% to 32.0%.23
Deep defense cuts. Since the 1980s, the Pentagon budget has fallen from 6% to 3% of GDP—not far above Europe’s target of 2%. Cutting U.S. defense spending to the levels pledged by European members of NATO would save 1% of GDP, or roughly one-seventh of the Social Security and Medicare long-term shortfall. And Europe’s target level is possible only because its leaders can count on protection from a larger superpower—a luxury that the U.S. would not enjoy. A healthy portion of America’s higher defense budget comes from spending $100,000 per troop in compensation (salary, pension, housing, health care, and other benefits), which lawmakers are not eager to cut.24 Some long-term budget savings are possible, though it should be noted that President Obama did not propose reducing the Pentagon budget to anywhere near the levels of France or the U.K.
Single-payer health care. When confronted with rising Medicare and Medicaid costs driving federal deficits, a popular response on the left is to propose single-payer health care. The theory here is that a fully socialized health plan would drastically slash costs to families and the federal budget.
The budgetary impact of single-payer health care has been widely debated over the past two years. However, it is important to emphasize that the estimated $30 trillion to $40 trillion federal cost of single-payer refers only to the federal cost of bringing those under 65 into the Medicare program (and expanding benefits for the elderly). It does not include the cost of closing the existing $44 trillion shortfall for those age 65 and older. In other words, even a “fully-funded” single-payer program would finance only the federal expansion, not the Medicare system’s baseline shortfall of $44 trillion. Perhaps lawmakers should figure out how to pay for the current Medicare system before pledging $30 trillion to expand it.
Chart 7
Tax Increases Cannot Easily Close the Social Security and Medicare Shortfalls
(Which by 2049, will total 6.4% of GDP – or 12.1% including resulting interest costs)
*Tax increase significantly includes low-income families
Notes:
- A) Estimates do not account for: 1) revenues lost to negative economic effect of policies, and 2) interactions between policies.
- B) The highest-income taxpayers currently pay a combined marginal tax rate (income, payroll, and state) of approximately 50%. Substantially higher tax rates would likely give back some of the new revenues due to reduced economic growth as well as tax avoidance.
- C) Sources: CBO, JCT, Social Security Office of the Actuary, Tax Foundation
Cross-Partisan Fantasies
Social Security trust fund to the rescue. Some suggest that redeeming the $3 trillion in assets held by the Social Security trust fund will shield taxpayers from the cost of Social Security’s deficits. In the first place, this $3 trillion accounts for a small fraction of the system’s $19 trillion cash deficit over 30 years. More important, the trust fund contains no economic resources with which to pay benefits—it consists of a pile of IOUs in a filing cabinet in Parkersburg, West Virginia. This $3 trillion in Social Security assets reflects a $3 trillion liability for the taxpayers, who must repay the bonds with interest over the next 16 years. All future Social Security benefits will be financed by future taxes and borrowing.
Long-term budget projections are just theory. Americans otherwise inclined to be skeptical of 30-year projections should nevertheless take these seriously. Future inflation rates are indeed anyone’s guess, but the 74 million baby boomers retiring into Social Security and Medicare are an actuarial and demographic reality. These present and future retirees exist, and the payment formulas have already been set. Furthermore, any future uncertainties are an argument for caution and prudence.
There is no hurry. Some assert that lawmakers can wait 10 or 15 years to address this challenge.25 Unfortunately, every year of delay raises the eventual cost of a budget fix because: 1) on average, 4 million more baby boomers retire into Social Security and Medicare, and lawmakers have generally avoided reducing benefits for those already receiving them; 2) benefit levels rise further above an affordable level; and 3) the larger national debt locks in permanently higher interest costs. The longer the reforms are delayed, the larger and more painful they must ultimately be.
Let the kids deal with the problem. The final argument against reform asserts that Social Security and Medicare benefits represent an unbreakable, unamendable promise to the elderly, consequences be damned. In reality, retirement benefits have been repeatedly expanded far beyond what current retirees were promised while they were working. For example, President George W. Bush and Congress decided in 2003 that current taxpayers would pay 75% of the prescription-drug costs of the current typical senior. This benefit was never “earned” through payroll taxes. And today’s teenagers never signed up for this budget-busting deal.
Conclusion
For decades, economists and policy experts warned that a budgetary and economic tsunami would come when the 74 million baby boomers retire into Social Security and Medicare. Nevertheless, nothing significant has been done to avert the crisis. To the contrary, both parties added a new Medicare drug entitlement in 2003, after which the Affordable Care Act further expanded federal health obligations for Medicaid and new subsidized health-insurance exchanges.
Today, one-third of the baby boomers have already retired, and another one-third will retire over the next six years. Annual budget deficits will soon pass $1 trillion on the way to $2 trillion and possibly $3 trillion in 10–15 years. Overall, the Social Security and Medicare systems face an unfathomable $103 trillion cash deficit over 30 years.
Without reform, runaway deficits will all but guarantee a debt crisis that will profoundly damage the country’s economic and social order. There is still time to avoid that crisis, but it will require the nation’s political leaders to leave their respective comfort zones and compromise.
Appendix

Endnotes
[1] All figures in this section were calculated by the author using the CBO’s 10-year baseline, “The Budget and Economic Outlook: 2019 to 2029,” Jan. 28, 2019, and the 30-year baseline at “The 2019 Long-Term Budget Outlook,” June 25, 2019 with the supplemental tables at https://www.cbo.gov/publication/51119. Calculations available upon request.
[2] The debt held by the public generally refers to debt funded by borrowing from the public. It does not include intragovernmental debt, such as the Social Security trust fund.
[3] See note 1.
[4] See Ernie Tedeschi, “Deficits are Raising Interest Rates. But Other Factors are Lowering Them,” February 19, 2019; Eric M. Engen, R. Glenn Hubbard, “Federal Government Debt and Interest Rates,” April 2005, NBER; Thomas Laubach, “New Evidence on the Interest Rate Effects of Budget Deficits and Debt,” Journal of the European Economic Association Vol. 7, No. 4 (Jun., 2009), pp. 858-885; and Edward Gamber and John Seliski, “The Effect of Government Debt on Interest Rates,” Congressional Budget Office, Working Paper, March 14, 2019.
[5] See note 1.
[6] C. Eugene Steuerle and Caleb Quakenbush, “Social Security and Medicare Lifetime Benefits and Taxes: 2017 Update,” Urban Institute, June 5, 2018, at. Figures in the text reflect Steuerle and Quakenbush’s table 15 for a married couple with two average earners ($102,600 in 2017 dollars).
[7] See note 1.
[8] See note 1.
[9] See note 1.
[10] See note 1.
[11] See note 1.
[12] See note 1.
[13] For an overview of the research on realistic productivity rates, see Committee for a Responsible Federal Budget, “How Fast Can America Grow?” May 18, 2017.
[14] Adding 0.6% to the annual economic growth rate would produce an additional $135 trillion in cumulative GDP for 2020–49, which translates to roughly $27 trillion in tax revenues and $9 trillion in interest savings on the national debt.
[15] See note 4.
[16] See note 1. Figures adjusted into a current-policy baseline.
[17] A much-hyped CBO report (“S. 744 Border Security, Economic Opportunity, and Immigration Modernization Act,” June 18, 2013) showed overwhelmingly positive budgetary effects of immigration legislation that would both increase immigration levels and provide legal status to a large number of unauthorized immigrants. The score limited most of its analysis of federal taxes and spending over 20 years. It ignored significant state and local government costs as well as longer-term Social Security and Medicare costs.
[18] See note 1.
[19] In 2019, antipoverty spending equals 3.9% of GDP, while nondefense discretionary spending is 3.2%.
[20] The spending function tables accompanying Trump’s FY 2020 budget proposal employ what is essentially an enormous “cuts to be determined” line item to meet its proposed discretionary spending caps. See Office of Management and Budget (OMB), “Budget of the United States Government, Fiscal Year 2020,” “Table 29-1. Budget Authority and Outlays by Function, Category, and Program,” row 1153, February 2019.
[21] See Scott Hodge, “News to Obama: The OECD Says the United States Has the Most Progressive Tax System,” Tax Foundation, Oct. 29, 2008. Even those figures underestimate this country’s current tax progressivity advantage because they do not include the 2013 upper-income tax increases and, more important, do not include the large value-added taxes that make European tax systems even less progressive.
[22] Calculated using IRS, “SOI Tax Stats—Individual Statistical Tables by Size of Adjusted Gross Income,” table 1.4. In 2017, the amount of income earned over the $500,000 threshold approximated 7.0% of GDP. An estimated 2.3% of GDP was paid in federal and state taxes on this income, leaving 4.7% of GDP in available take-home pay.
[23] Calculated using tax estimates in chart 7.
[24] CBO, “Costs of Military Pay and Benefits in the Defense Budget,” November 2012, p. 2.
[25] This argument is most commonly associated with the talking point that Social Security is “fully funded” through 2034. Yet it is fully funded only because taxpayers will be repaying trillions to the Social Security trust fund over that period. These general revenue transfers will burden taxpayers and force up budget deficits each year.
Are you interested in supporting the Manhattan Institute’s public-interest research and journalism? As a 501(c)(3) nonprofit, donations in support of MI and its scholars’ work are fully tax-deductible as provided by law (EIN #13-2912529).