The Rise of College-Educated Democrats

In the last 15 years, the Democratic Party coalition has undergone a dramatic demographic change. The white share of the party has declined significantly. But at the same time, the whites who have remained in (or have newly aligned with) the Democratic Party are far more likely to be college educated than in the past. In 2020, for the first time on record, the college-educated white share (27.3%) of Democrats exceeded that of non-college-educated whites (25.2%). The largest Democratic majority is now made up of non-college-educated nonwhites (32.8%) and college-educated whites (27.3%).
There will likely be some tension within this new coalition when it comes to political priorities. Those with a college education tend to be wealthier and have higher socioeconomic status than those without, but they also tend to be more socially liberal and more likely to prioritize post-material moral concerns over kitchen-table issues.
Furthermore, the increasing share of college-educated white Democrats will probably also be more able to effectively realize their priorities than their nonwhite and non-college-educated co-partisans. The association between education/wealth and political participation/influence is well-documented in the political science literature, and the available evidence already shows signs of emerging gaps in political participation, influence, and knowledge between these groups of Democrats.
This report argues that these demographic trends beget an awkward paradox: the Democratic Party will likely become a majority-minority party relatively soon, but one that is still largely and disproportionately steered by liberal college-educated whites.
Another potential consequence—which may already be happening—is that white progressives’ dominance over the Democratic Party agenda will alienate at least some socially conservative working-class nonwhites, thereby driving a small but electorally consequential subset of them into the arms of Republican Party candidates, if not into the party itself.
Introduction
The Democratic Party has long been regarded as the party of the “common man” or “working class” and the Republican Party the party of “big business” and the wealthy. Indeed, one political science textbook from 1998 says of the parties’ coalitions: “lower-status people, those with less education, those with low incomes, recently immigration ethnic groups, racial minorities, and Catholics are more likely to vote Democratic. Higher status people, the college-educated, those with high incomes, whites of northern European stock, and Protestants are more likely to vote Republican.”[1] This taxonomy remained fairly accurate into the 21st century. Data from the American National Election Studies (ANES) show that, in 2000, just under 80% of selfidentified Democrats were either non-college-educated whites (48.9%) or nonwhites (30.3%). Meanwhile, college-educated whites constituted 26.8% of all self-identified Republicans, which was larger than both the college-educated white (14.7%) and nonwhite (5.4%) shares of self-identified Democrats combined (Figure 1).
Figure 1
Trends in the educational and racial composition of self-identified Democrats and Republicans
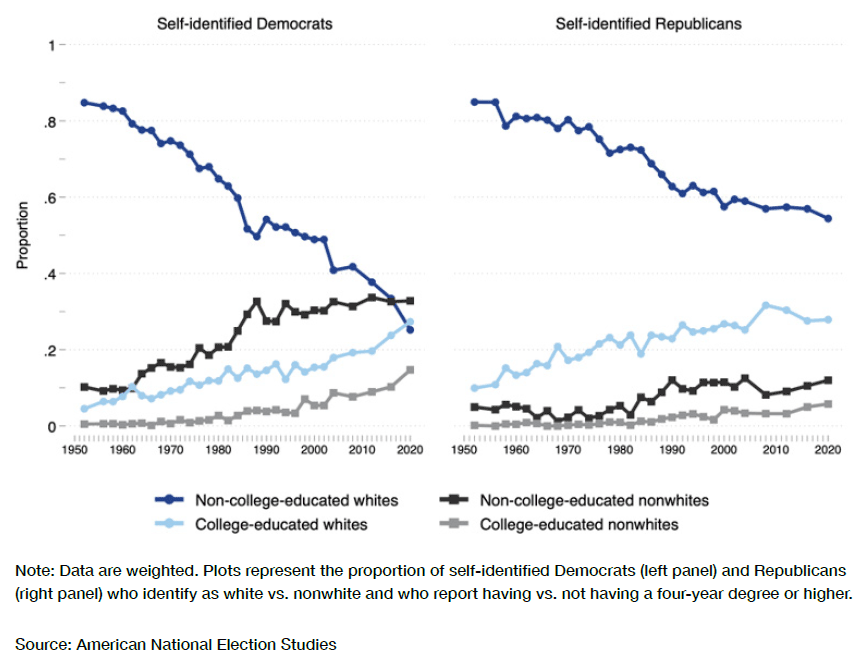
But the traditional account of the Democratic and Republican coalitions has become increasingly obsolete. Although non-college-educated whites and nonwhites still constituted the majority (66%) of self-identified Democrats as recently as 2016, the former demographic has steadily declined while the share of college-educated whites has steadily risen—particularly since 2008.
In the Republican camp, in contrast, the share of college-educated whites crested in 2008 and has been falling ever since. Coincidently, the share of non-college-educated whites, which was in secular decline across the previous 50 years, began to stabilize.
These diverging within-party and between-party trends finally came to a head in 2020 when, for the first time on record, the college-educated white share (27.3%) of self-identified Democrats exceeded that of non-college-educated whites (25.2%). In fact, despite the markedly differing racial compositions of the two parties, the college-educated white share among Democrats was virtually almost the same as—and has likely since surpassed—the college-educated white share of self-identified Republicans. As of 2020, non-college-educated nonwhites (32.8%) and college-educated whites (27.3%) now constitute the largest Democratic majority.
The Democratic Party has thus transmogrified from a party of the “working class” into a party of educated white elites and non-college-educated racial/ethnic minorities. Yet it is also one on the cusp of being majority nonwhite. These two trends, I argue, beget an awkward paradox: the white share of the Democratic Party is declining, while the white Democrats who are left become more educated and wealthier—and more liberal—than ever before. To the extent that socioeconomic status is correlated with political participation and influence, the Democratic Party will likely become a majority-minority party that is largely steered by white liberals for years to come.
If the political priorities of white Democrats were in lockstep with their nonwhite counterparts, these trends would probably not be politically meaningful. But insofar as wealthier college-educated Democrats tend to be socially liberal and more likely to prioritize post-material moral concerns over kitchen-table issues, some divergence between white and nonwhite Democrats is inevitable. Owing to their greater political influence, the attitudes of white Democrats are more likely to shape the rhetoric and agenda of party elites. A potential consequence—which may already be happening—is that white progressives’ dominance over the Democratic Party agenda will alienate at least some socially conservative working-class nonwhites, thereby driving a small but electorally consequential subset of them into the arms of Republican Party candidates, if not into the party itself.
Historical Background
How did the Democratic Party transform from a party predominated by working-class whites and nonwhites to a party of white elites and working-class nonwhites? I contend that this shift is attributable to two broad factors: rising levels of higher educational attainment—including racial disparities therein; and long-term and more recent political-cultural polarization that is most pronounced among white Americans.
In the past 70 years, rates of college-degree attainment have increased across the board. Until recently, these trends have been largely bipartisan; as the share of educated Republicans has increased, so has the share of educated Democrats. More precisely, according to ANES data, from 1952 to 2008, the share of Democrats with college degrees increased by 0.81 percentage points, on average, between survey waves (two to four years) while the share of Republicans increased by an average of 0.92 points. Degree attainment also increased for whites and nonwhites in both parties, but to differing degrees. The average between-wave rate of growth during this period was 0.98 points for both white Republicans and Democrats; it was somewhat less than half that (0.55 points) among nonwhite Democrats.
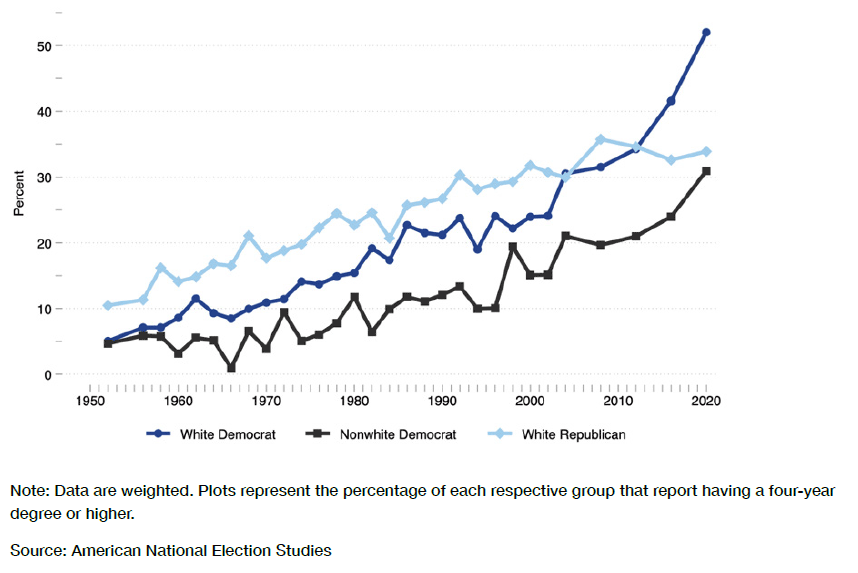
But around 2008, the rates and direction of change among white partisans diverged. As shown in Figure 2, as the share of white Democrats with college degrees jumped from 31.5% in 2008 to 52% in 2020, the share of white Republicans fell from 35.7% to 33.9%. For nonwhite Democrats, degree attainment rates also grew during this period—but again, by a smaller margin: roughly half that (11.3 points) of their white counterparts (20.5 points). Remarkably, their attainment rates now more resemble those of white Republicans than those of their white co-partisans.
Figure 2
Increasing educational attainment across time
Recent growth in the rates of degree attainment among white Democrats has been so sharp that the gap between the share of white and nonwhite Democrats with college degrees has reached its the largest on record. Averaged by decade, this gap grew from 5.3 points in the 1960s to 9 points in the 1990s. It then grew only modestly (to an average of 9.8 points) in the first decade of the 2000s, before exploding to an average of 17.3 points between 2012 and 2020. As of the 2020 ANES, it stood at just over 21 points, including 26- or 27-point differences between white (52%) vs. black (26%) and Hispanic (25%) Democrats.
Is the recent surge in educational attainment caused by more white Democrats attending college, or by more whites with college degrees becoming Democrats? Figure 3 attempts to answer this with results from cross-lagged panel models of data from two panel surveys (which track the same individuals over time). Both models show that white educational attainment (e.g., in 2011) significantly predicts subsequent (e.g., in 2016) Democratic Party identification net of earlier (e.g., in 2011) party identification. White party identification, in contrast, does not meaningfully predict subsequent educational attainment net of previous educational attainment. These two relationships are also statistically distinguishable from each other, with the first being significantly stronger than the second.[2] What these results confirm, then, is that increases in white Democrats’ rates of degree attainment over the past 10 years resulted not only from more white Democrats[3] attending college but from the alignment of previously unaligned college-educated whites with the Democratic Party.[4]
Figure 3
Cross-lagged panel models of white educational attainment and party ID

The culmination of these trends is depicted in Figure 4, which shows the relative group representation (whites vs. blacks + Hispanics) among Democrats by decade. These estimates are calculated by dividing a group’s share of college-educated Democrats in each decade by its share of Democrats as a whole in each decade. Despite constituting a declining share of self-identified Democrats as a whole, whites have become increasingly overrepresented among self-identified Democrats with college degrees.[5]
Figure 4
Relative group representation among Democrats with four-year degrees or higher

Political Polarization and Party Realignments
Educational polarization (or the “diploma divide”) among white Americans did not begin with the election of Donald Trump—though he certainly accelerated it as never before. Rather, this process can arguably be traced to as far back as the late 1950s.
Prior to the Reagan era, and especially in the 1950s and 1960s, the two parties were divided more internally than anything else. Both parties had both conservative and liberal wings, so party labels did not have the same political and cultural connotations that they’d acquire in later decades. Moreover, in Congress, conservative and liberal legislators from opposing parties frequently colluded to scuttle the legislative agenda of in-party political opponents. The result was political incoherence—the party in power was often sending mixed signals about what it stood for.
Due to this ideological heterogeneity and conflict within the parties, split-ticket voting (e.g., voting for a Democratic presidential candidate and a Republican House candidate) was fairly common, particularly in the 1970s. In fact, as shown in Figure 5, party (Republican/Democrat) and ideological (liberal/conservative) identification were only weakly correlated at the individual level, for whites and nonwhites alike, until roughly the mid-1990s.
Figure 5
Correlation between party and ideological identification across time

But changes to the composition of the parties’ coalitions were already under way. The bipartisan passage of the Civil Rights Act notwithstanding, both parties gradually but increasingly adopted divergent positions on civil rights and other social issues as a means of appealing to new constituencies and solidifying support among existing or ascendant others. The upshot was that party labels started to take on substantive meaning. Voters increasingly had two distinct political brands to choose from, and they gradually (across several decades) sorted into them accordingly.
Though less apparent initially, this sorting would ultimately occur along educational lines, particularly among white Americans. In fact, this was probably inevitable. College-educated whites—and the college-educated in general—have long been more socially liberal and less religious, on average, than their less educated counterparts. At the same time, college-educated whites tend to earn higher incomes and thus prefer low-tax policies (a pillar of the GOP’s platform for decades). As long as the Republican Party was not too conservative on social and racial issues, the Democratic Party’s appeal to college-educated whites was limited. But as the Republican Party became more outwardly socially conservative, and the Democratic Party more outwardly socially liberal, college-educated whites started to flock toward the latter, and non-college-educated whites toward the former. This movement, in turn, further incentivized socially liberal and conservative position-taking, respectively, on the part of Democratic and Republican Party elites.
This initially gradual educational realignment process can be seen in the blue lines of Figure 6, which represent the average effect of a college degree on the odds of a white respondent identifying with the Republican vs. Democratic Party in the American National Election Studies (light blue line) and General Social Survey (GSS) (dark blue line). While having a college education positively (negatively) predicts Republican (Democratic) Party identification across most of these time series, these effects begin to substantially reverse after the 1970s. According to ANES, a white person with a college degree in the 1960s was, on average,15.5 points more likely to identify as a Republican. In the 1970s, that dropped slightly, to 13.6 points more likely. But by the 1980s, a college-educated white was, on average, only 7.1 points more likely to be a Republican.
This decline stabilizes somewhat in the 1990s (at least in ANES) before continuing in the first decade of the 2000s. In 2004—an election year in which “moral values” figured as a top voter concern—the effects would turn negative (0.7 points less likely to identify as Republican) for the first time in the history of ANES.
Interestingly, this downward trajectory is also manifest in the relationship between party identification and Wordsum vocabulary test scores in GSS (gray line). On average, a standard-deviation increase in correct answers predicted a significant 4.8-point increase in the odds of a white person identifying as Republican in the 1970s, a 2.8-point increase in the 1980s, and a 1-point increase in the 1990s. This relationship then shifts directions in the first decade of the 2000s such that a one-standard-deviation (SD) increase in test scores predicts a 1.5-point decrease (increase), on average, in the likelihood of Republican (Democratic) self-identification.
Figure 6
Effects of a college degree and vocabulary test scores on the odds of Republican (vs. Democratic) Party identification among whites

As the parties increasingly differentiated themselves with respect to issues such as abortion, same-sex marriage, and gun control (which became conspicuously partisan only in the 1990s), more fault lines would emerge. These trends were also reinforced by a sort of positive feedback loop. As college-educated whites—who have long been more cosmopolitan and socially liberal than their less educated counterparts—made up a larger share of the Democratic Party, party elites and candidates had less to lose and more to gain from taking positions that would have been electorally risky in years past. They could, for instance, champion amnesty for undocumented immigrants without worrying that doing so would occasion backlash on the part of socially and racially conservative white Democrats. Instead, the concern increasingly becomes whether they are pressing the right “buttons” to attract and/or maintain the support of white liberal activists and donors. And the resulting party’s priorities are only more attractive to college-educated whites.
Likewise, the growing preponderance of non-college-educated whites within the Republican Party incentivizes party leaders and candidates to move in a more outwardly culturally conservative (or protectionist) direction, particularly on issues like immigration and international trade. Moderate Republicans—business-friendly fiscal conservatives who are more subdued when it comes to sociocultural issues like immigration—started to face stiffer political headwinds and were increasingly replaced by more outspokenly conservative “culture warriors” who were as committed to curbing immigration and resisting “amnesty” as they were to rolling back federal regulations and liberal social programs.
This brings us to the Trump election, which made the parties’ contrasting moral-cultural orientations as clear as they have been. Trump may have been relatively more economically liberal than past Republican presidential candidates—he was arguably to the left of his opponent (Hillary Clinton) on issues like trade and foreign policy. But his unabashed immigration restrictionism, anti-intellectualism, anti-cosmopolitanism, and general rejection of taken-for-granted norms of political correctness horrified and repulsed college-educated whites as no Republican presidential candidate had before him. From their standpoint, the racism and moral degeneracy of the Republican Party were on full display.
Due to Trump’s effect on the Republican Party’s brand, a process that gradually unfolded across decades would soon undergo a dramatic escalation. Returning to the ANES series in Figure 6, after having a near-zero effect in 2012, a college degree predicted a significant 9.5-point reduction in the odds of a white person identifying as a Republican (vs. Democrat) in 2016, and a remarkable 18.1-point decrease in these odds in 2020. Though beginning earlier, a comparable shift is observed in GSS. Whereas a college degree predicted a very modest and insignificant (–0.7-point) decrease in the likelihood of a white person identifying as a Republican in 2010, this negative effect grew to –5.1 points in 2012, –7 points in 2016, –9.5 points in 2018, and –18.7 points in 2021.
In other words, in the space of roughly 10 years, a college degree went from having little to no meaningful association with whites’ party identification to predicting just under a 20-point greater chance of identifying as Democrat vs. Republican. Given that just under half and over half, respectively, of college-educated whites in ANES and GSS identified as Democrats in the most recent survey waves, Democratic identification among this demographic may still have to room grow in the years and decades ahead.
From Educational Gaps to Economic Gaps
Given the educational realignment described above, we might expect to observe widening disparities between parties in other socioeconomic indicators. Those with college degrees, for example, also typically earn more money than those without. These gaps are shown in Figure 7, which, among other things, plots a time series of median personal income differences between white and non-Asian/nonwhite Democrats and between white Republicans and Democrats. These data, which come from GSS, indicate that the white vs. non-Asian/nonwhite Democrat median personal income gap (blue line, left panel) more than doubled between 2014 ($7,390) and 2016 ($15,428).[6] As of 2018—the last GSS wave in which this outcome was measured—it sat at $15,773, which is easily the largest disparity in the entire series. Meanwhile, the median earnings of white Democrats surpassed those of white Republicans (by $7,010) for the first time since GSS launched in 1972.
Figure 7
Gaps in socioeconomic indicators

Unsurprisingly, differences in indexes of occupational prestige generally adhere to the same patterns. Prior to the 2010–18 period, on GSS’s occupational prestige index (a scale based on respondents’ ratings of the social standings of various occupations), white Democrats scored 0.24–0.34 SD higher than non-Asian/nonwhite Democrats, on average, in each decade. Beginning in 2010, this difference shoots up to and remains at about 0.41 SD until 2018, when it reaches 0.53 SD—the largest of the series. Once again, the gap between white Republicans and Democrats trends in the opposite direction. From the 1970s through the 1980s, white Republicans scored 0.16–0.20 SD higher than white Democrats. This advantage shrinks to an average of 0.08 SD in the 1990s and to 0.05 SD in the 2000s. In 2016, it would dip (slightly) below zero for the first time in the series. By 2018—the final year in which this variable was measured—the average white Democrat was scoring 0.094 SD higher than the average white Republican.
The right panel in Figure 7 shows that disparities are also widening in subjective or self-descriptive measures of socioeconomic class. Until 2000, white Democrats were never more than 7.8 points—with an average of 6.2 points—more likely than non-Asian/nonwhite Democrats to describe themselves as belonging to the “upper-middle” or “upper” class. From 2000 and onward, though, these differences averaged just under 12 points, including a high of just over 18 points (28.7% vs. 10.5%) in 2020. Finally, until 2016, white Republicans were always at least marginally more likely to self-identify as upper-middle/upper class than white Democrats. By 2020, however, the latter group was roughly 11 points more likely (28.7% vs. 17.4%) to do so than the former.
In sum, as white Democrats have become relatively more educated than nonwhite Democrats and white Republicans, they have also become relatively wealthier and more likely to work in high-status occupations than ever before. If socioeconomic status had no bearing on political participation and influence, this report could probably end right here. But that is not the world we live in. In what follows, I argue that growth in the relative socioeconomic advantage of white Democrats is likely to afford them outsize control over the agenda and direction of the Democratic Party for years to come.
Inadvertent Consequences: From Socioeconomic Gaps to Gaps in Political Engagement and Influence
For those concerned with unequal political representation in American democracy, the enlargement of socioeconomic gaps between white and non-Asian/nonwhite Democrats should be troubling. The association between education and political participation is one of the most robust and replicated findings in the political science literature. The precise nature of this relationship—e.g., whether education in and of itself causes political participation or is rather a proxy of social status and more specific causal variables, such as cognitive ability—remains an object of scholarly debate.[7] But education—and/or the constellation of variables that its influence captures—is robustly predictive of various forms of political engagement. To the extent that the voices of the politically engaged are more likely to influence and be reflected in political outcomes, increases in the socioeconomic position of white Democrats vis-à-vis nonwhite Democrats portend that the former will continue to disproportionately control the levers of power within the party indefinitely.
This matters on the ground because, as political scientists Charles Lindblom and Edward Woodhouse once put it, “if poorer, less educated minorities participate less, their judgments about what problems deserve government’s attention will attain less than proportionate weight in the process of partisan mutual adjustment.”[8]
Gaps in Political Attention and Interest
One reason those with higher levels of education and socioeconomic status show more political engagement is that they have higher levels of political attention—they are more likely to attend to, and are more frequent consumers of, political information.[9] Consequently, those with higher degrees of political attention will naturally enjoy a “first-mover” advantage when it comes to receiving and acting upon political information (e.g., donating to a political cause or candidate, contacting elected officials) and, ultimately, in shaping public opinion and political outcomes. In contrast, those with lower degrees of political attention are slower to become aware of and respond to political developments and are thus more likely to be followers than leaders or shapers of political discourse and outcomes.
Growing gaps in socioeconomic status, therefore, may lead to growing gaps in political engagement between white and nonwhite Democrats. Indeed, this is already happening, as shown in Figure 8, which graphs multiple times series of the difference between the share of white and nonwhite Democrats who report following or attending to information related to government, politics, or public affairs “Always” or “Most of the time.” In the longer ANES and Pew series, we see that, prior to the 2000s, the share of white Democrats giving this response rarely exceeded that of nonwhite Democrats by more than 10 points. Since around 2012, however, this gap has consistently approached, if not surpassed, the 20-point mark. In the most recent data point,[10] which comes from a July 2021 Pew survey, white Democrats (42.8%) were nearly twice as likely as nonwhite Democrats (21.8%) to give a “Most of the time” response.
Figure 8
White vs. nonwhite Democrat gaps in attention to information about politics, government, public affairs

Another, arguably better,[11] way to measure political attention is to provide respondents with a list of various news topics (e.g., entertainment, sports, health) from which they are asked to select the one that they follow most often or closely. AP-NORC’s Media Insight Project has taken this approach since 2016. The available data from this series are graphed in Figure 9.[12] While it’s unclear what these figures looked like before 2016, white Democrats were (depending on the year) 14 to 20 points more likely than black Democrats, and 15 to 26 points more likely than Hispanic Democrats, to select “national politics or government.”[13]
Figure 9
Share of white, black, and Hispanic Democrats selecting “national politics or government” as the news topic they follow most often or closely

These disparities in political attention perhaps explain why, despite the absence of meaningful racial/ethnic group differences in social media use overall, white Democrats nonetheless report greater exposure to political social media content. A July 2020 Pew survey shows that, among social media users (76% of the sample), white Democrats were, on average, nearly 13 points more likely than their nonwhite counterparts to say that “A lot” of what they see on social media is related to politics (Figure 10). In the right panel, we see that these differences may be even larger among Twitter users. Whereas just under 53% of Twitter-using white Democrats indicated that “A lot” of what they see on Twitter is related to political and social issues, this figure falls to an average of 27% among their nonwhite counterparts.
Figure 10
Political social media exposure among Democratic social media and Twitter users

Given that political discourse on social media, and on Twitter in particular, increasingly serves an important agenda-setting function,[14] these differences are likely to have consequences for the distribution of political influence within the Democratic Party. Greater exposure to political content on social media means that white Democrats have more opportunities to acquire, respond to, and even produce new political information—and, ultimately, to steer the political attention of party and media elites. On this last point, it’s worth noting that an estimated 85% and 70% of political tweets are authored by Democrats and college graduates, respectively.[15] While speculative, the fact that 56% of white vs. 38% of nonwhite Democrat Twitter users in this data set have college degrees[16] suggests that white Democrats are very likely responsible for a disproportionate, if not dominant, share of political tweets, including those viewed by Democratic politicians, candidates, or their staff members.
Gaps in Political Knowledge
Of course, anybody can report being interested in or closely attending to political information. But if those who do are unable to recall even basic political knowledge, interest and attention are likely to be overreported (i.e., people are lying), superficial, or nonproductive. Moreover, between-group differences in these outcomes are likely to be understated.
A more objective means of assessing differences in cognitive political engagement is thus to compare groups’ performance on indexes of political knowledge. To this end, Figure 11 displays the difference between the share of white vs. black/Hispanic[17] (blue lines) and Asian (gray lines) Democrats who correctly answered differing sets of items in a seven-item index of political knowledge across the 2008–20 waves of the Cooperative Election Study (CCES). As political scientists have long known, levels of political knowledge can vary from year to year or from election to election, for reasons other than political attention. Certain pieces of information, for example, may become more salient in some media outlets, giving some citizens greater opportunity to acquire them.
Figure 11
Racial gaps in political knowledge among Democrats

These data show that the two largest—and most socioeconomically disadvantaged—groups of nonwhite Democrats consistently exhibit significantly lower levels of basic political knowledge than white (and, more recently, Asian) Democrats. For instance, across the series, white Democrats were, on average, 14–30 points more likely than black and Hispanic Democrats to correctly identify the majority party in both houses of Congress. In 2020—the year in which this gap reached a series high—73% of white Democrats (and 65.2% of Asian Democrats) were able to do so, as compared with just 41.2% of black and 46.5% of Hispanic Democrats. Remarkably, since 2008, the latter two groups were 18–25 points less likely than the former to correctly rate the Democratic Party as more liberal (less conservative) than the Republican Party on a seven-point liberal–conservative ideology scale.[18] Even if ideological labels do not share the same meaning across groups, the parties have diverged to such an extent that only the most politically disengaged and unsophisticated could regard them as ideologically equivalent or construe the Democratic Party as just as conservative as, or more conservative than, the Republican Party. To make matters worse, black and Hispanic Democrats have been 15–24 points less likely than white Democrats to know the parties of their state’s senators and 10–15 points less likely to know the party of their district’s House member.
On the seven-item index as a whole, the gap between these groups has generally approached, if not surpassed, half a standard deviation (or more than one correct answer). This average obscures the fact that the share of white (and Asian) Democrats who correctly answered all seven items has grown since 2008, whereas it has grown relatively more modestly for blacks and Hispanics. In 2020, 57% of white Democrats had perfect scores (up from 31.7% in 2008 and 36.3% in 2012), as compared with 26.3% of black (up from 15.5% in 2008 and 15.7% in 2012), 29.7% of Hispanic (up from 18% in 2008 and 12.1% in 2012), and 45.6% of Asian Democrats (up from 24.5% in 2008 and 26.7% in 2012).
Gaps in political knowledge are even wider in ANES, which features a relatively larger and more diverse set of measures.[19] Figure 12 shows that in 2012, white Democrats scored 0.46–0.68 SD higher (or 1.7–2.5 correct answers better), on average, on a 16-item index of political knowledge[20] than black and Hispanic Democrats, respectively. In 2020, these gaps grew to 0.91–0.84 SD (or 3.3 and 2.4 correct answers better), on average, respectively.[21]
Figure 12
Democratic scores on 16-item political knowledge by race/ethnicity

Political scientists debate that such indexes genuinely reflect differences in political knowledge and sophistication. But the same gaps are increasingly apparent even in subjective/self-rated measures of political sophistication. Figure 13, for example, shows that in 2008, white Democrats (40.5%) were just under three points more likely than nonwhite Democrats (37.8%) to indicate that they “some of the time” or “never” find politics so complicated that they “can’t really understand what’s going on.” In each ANES wave since, this gap has grown—to 5.2 points in 2012 (46.9% vs. 41.7%), 11.7 points in 2016 (50% vs. 38.3%), and 17.8 points in 2020 (63.1% vs. 45.3%). At the same time, white Democrats have become significantly less likely than nonwhite Democrats to say that they can’t understand what is going on either “most of ” or “all the time.” In 2008, white Democrats were actually three points more likely to give this response (34.5%), compared with nonwhite Democrats (31.5%); but in 2020, nonwhite Democrats were 10.2 points more likely to give this response (26.5%) than the former group (16.3%)—a net swing of just over 13 points.
Figure 13
Trends in Democrats’ self-assessed “ease” of understanding politics

The growth in the Democratic alignment of college-educated whites may perpetuate—or, at the very least, will do nothing to narrow—these gaps in political knowledge and sophistication. If these gaps continue to grow, nonwhite Democrats (blacks and Hispanics, in particular) will be at a serious disadvantage when it comes to engaging in effective political action—for not only is knowledge of, say, the party affiliations of one’s representatives practically useful; its absence is a bellwether of general political disengagement and apathy. Thus, whether because of the effects of knowledge itself or the political (un)awareness reflected therein, groups with relatively lower levels of political knowledge are likely to struggle to mobilize politically in numbers commensurate to their size: they will struggle to realize the full potential of their political voice or to punch at their political weight—let alone above it.
Gaps in Political Contact
We can also examine disparities in the rates at which different groups engage in one of the most influential forms of political participation: direct communication with elected representatives and candidates. Direct communication contrasts with the act of voting, which, as Schlozman, Brady, and Verba note, “is a notably blunt instrument of communication,” in that elected officials gain only “an imprecise understanding of what was on the minds of voters who placed them in office.”[23] Because conducting surveys is expensive, constituent correspondence is a primary means through which legislators learn about their voters’ concerns.
The problem, of course, is that the constituents who are most likely to contact their elected officials skew toward the educated and socioeconomically advantaged, whose concerns are more “post-material” and less centered on practical quality-of-life issues. A risk, then, is that as gaps in socioeconomic status between white and nonwhite Democrats widen, so, too, might gaps in rates of contacting public officials and, thereby, in the ability to shape legislative and party agendas.
Is this now the case? Unfortunately, the available data cannot give an unequivocal answer to this question. Survey measures of personally initiated political contact are imperfect; not only do they rely on respondent self-report, but they are variable (different instruments or wording are used in different surveys) and, for the most part, are not consistently administered across long stretches of time. As a result, estimates of contact between and even within surveys may not be comparable.
With this limitation in mind, Figure 14 presents all the publicly available data on rates of respondent-initiated political contact. In the left panel, each data point represents the percentage-point gap between the share of white vs. nonwhite Democrats who reported contacting a “public,” “government,” or “elected” official in the previous year. The right panel graphs the data in terms of white Democrats’ relative representation among the self-identified Democratic “contacters” in each survey year (i.e., the white share of self-identified Democrats who report contacting officials divided by the white share of all Democrats).
While there is much to unpack here, the main takeaways can be summarized as follows. Prior to 2010, white Democrats were never much more than 10 points more likely than nonwhite Democrats to report contacting public or elected officials over the previous year. From 2010 and onward, though—and particularly in recent years—10 points generally become the lower-bound differential. Many now approach or exceed 20 points, with one (WashPost/Kaiser) that falls just shy of 30 (though this specific measure asked about the past two years).[24] Similarly, until 2010, the white share of Democratic “contacters” only rarely exceeded the white share of self-identified Democrats by more than 20%. Since then, with few exceptions, the former has consistently exceeded the latter by 20%–43%. For instance, in the longer Pew series (solid light blue line), whites constituted 67% of self-identified Democrats and 77% of Democratic “contacters” in 2000. While the former figure falls to 52% by 2018, the latter only declines to 70%.
Figure 14
Racial disparities in Democratic constituent-initiated political contact

While the discordance across items means that we can’t know for sure, these data do suggest that racial gaps in Democrats’ contact with elected officials have been larger in the past 10 years than at any previous time on record. To be clear, this does not seem to be the result of nonwhite Democrat rates declining, or even remaining static. Their contact rates have increased, but not by nearly as much as the rates for white Democrats have. This is to be expected as college-educated whites replace less educated whites within the party. Thus, when elected and public officials hear from their Democratic constituents, they are likely to be increasingly disproportionately hearing the concerns and preferences of educated, wealthier white voters—with all the implications that this entails.
The Donation Gap
Of course, contacting one’s congressional representative official doesn’t guarantee a meeting or any response at all. But as political scientists Kalla and Broockman show, congressional offices are more likely to accept meeting requests from those identified as campaign donors.[25]
Donors are inherently a more exclusive group; anybody with a phone, car, or Internet connection can contact an elected official, but not everyone is financially positioned to contribute meaningful sums of money. As the costs of election campaigns have risen dramatically in the past 30 years, and as political candidates have become predominantly reliant on individual donors to fund them, a body of evidence suggests that legislators have become more responsive to the preferences of the socioeconomically advantaged.[26] There is thus reason to worry that the enlargement of socioeconomic gaps between white and nonwhite Democrats will also worsen, or at least slow, the closing of disparities in political donation behavior (and the political access that it confers), thereby further solidifying the voice of the former relative to the latter.
As in the case of political contact, all the publicly available data I could assemble similarly reveal recent growth in the disparities in white vs. nonwhite Democrats’ rates of self-reported donations to political candidates. The left panel of Figure 15 shows that, prior to 2010, the largest “donation” gap recorded in any data set was roughly 10 points, which itself was very rare. Thereafter, and particularly since 2015, the gaps consistently surpass 10 points, with some approaching and even exceeding 20 points. For instance, in the ANES series (dark blue line), this 10-point threshold was first breached in 2020, when 32% of white vs. 16% of nonwhite Democrats reported making a political donation over the previous year. Similarly, in the Pew series, they remained below five points until 2012 (19.6% vs. 14.4%). Since 2016, they have remained in the 13–15-point range in every year, including in 2020, when 30.1% of white Democrats vs. 14.8% of nonwhite Democrats reported donating to political candidates.[27] As we saw with the data on “contacters,” the right panel of Figure 15 also suggests that whites’ representation among Democratic donors is increasingly disconnected from their representation among Democrats at large.
Figure 15
Racial disparities in Democrats’ political donation behavior

But these data almost certainly understate the disparities, since they measure only the number of donors, rather than amounts of donations. Whites are increasingly overrepresented among large or “itemized” donors (those who contribute $200+) to Democratic candidates. In fact, two recent studies—which use data from the Federal Election Commission to estimate the race/ethnicity of donors from their surnames—show that the white share of large donations to Democratic congressional candidates remains more or less static across time even as the white share of self-identified Democrats is steadily declining.[28] Time series from these two data sets, which were generously shared with me by the respective authors, are visualized in Figure 16. The first, which is represented by the solid dark blue line in the left panel, represents the white share of all large individual hard money contributions to Democratic House candidates between 1980 and 2012. Averaged by decade, this share fell from just under 91% in the 1980s to 88.8% in the 1990s, 88.4% in the 2000s, and 87.1% across the 2010 and 2012 elections. The second (dashed dark blue line) runs from 2006 to 2020 and shows the white share of large donations to Democratic House and Senate candidates via ActBlue, which has become the dominant election fund-raising conduit for Democratic Party candidates. Little to no net changes are observed in this series. For instance, roughly 87% and 85% of large donors were white in 2008 and 2012, respectively, as compared with 87.6% and 87.1% in 2016 and 2020.
Figure 16
White share of large and small donors to Democratic congressional candidates

Taken together, whereas the white share of all self-identified Democrats fell more than 24 points between 1980 and 2020, the white share of large donors to Democratic congressional candidates fell only modestly (3–4 points). The upshot, which is manifest in the dark blue lines in the right panel, is that whites have become more overrepresented among large Democratic donors than ever before. Although their share of small donors (dashed gray line in left panel) declined nearly 14 points between 2006 (91.7%) and 2020 (79.4%), the degree to which they are overrepresented among small donors has not (dashed gray line in right panel). At existing rates, it could take hundreds of years before whites no longer constitute the majority of large Democratic donors; and they may be significantly overrepresented among both types of donors even longer than that. While it’s difficult to know how these figures would look without the growth in college-educated whites’ alignment with the Democratic Party, it is hard to imagine this trend having no effect on the pace of representational convergence.
These realities go a long way toward explaining the Democratic Party’s leftward shift on social and cultural issues across time, and especially in recent years. David Broockman and Neil Malhotra, for example, find that Democratic donors are similar, though still slightly more liberal, to non-donors on economic issues but are far more liberal on social issues (e.g., capital punishment, gun control, abortion) and globalism (e.g., immigration, foreign trade).[29] Given the extent of their overrepresentation among Democratic donors, white Democrats are thus likely a major driver of the party’s increasing social and cultural progressivism. As noted, legislators are not only more responsive to the preferences of donors, but they are also more likely to meet with them. This means that white Democrats have much greater “access” to politicians, which allows them to effect policy outcomes that are far more liberal than would be the case if the strength of their voice was actually commensurate to their (declining) share of the party.
The Voting Gap
Contacting and donating to elected officials are influential but demanding forms of political participation (whether in terms of money or cognitive skills), which, in general, we would expect only a socioeconomically advantaged minority of the public to engage in. Voting, on the other hand, is a basic participatory act that is accessible to the underprivileged and politically unsophisticated. As such, one might expect the turnout rates of white and nonwhite Democrats to be relatively similar—especially in 2020, when states across the country relaxed restrictions on mail-in ballots.
If we take respondents at their word—which we are often forced to do—this is indeed the case. For instance, in the 2020 CCES, 94.5% of white Democrats reported voting in the 2020 election, as compared with 90.3% of nonwhite Democrats—a substantively small differential. But with an official nationwide turnout of 66.9%, these numbers are clearly much too high. Fortunately, we no longer have to take respondents at their word. In recent years, several election surveys, including CCES, have begun matching respondents’ personal identifiable information to public voter files, such as Catalist, that officially record whether a person has voted.
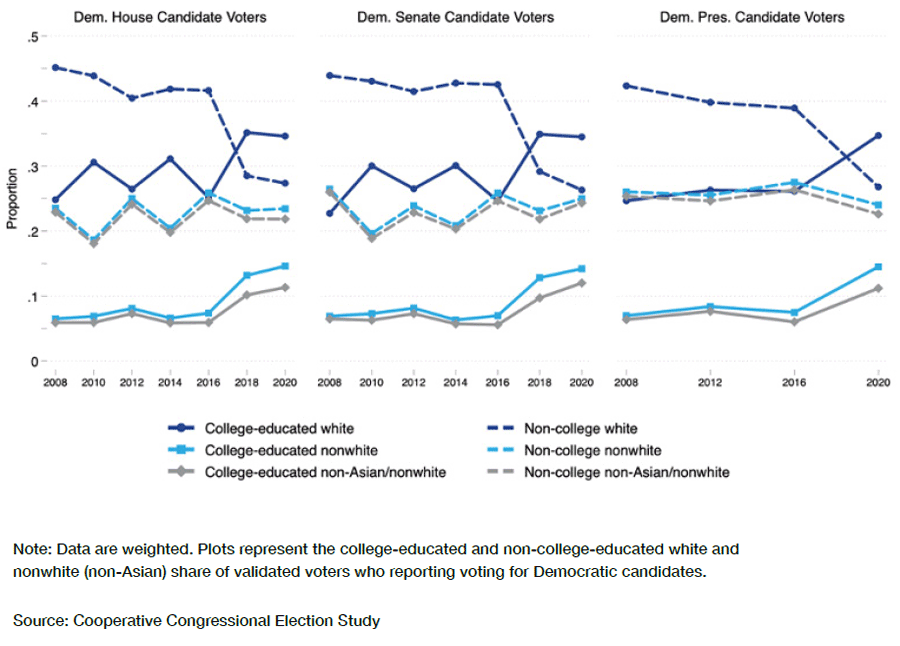
Accordingly, using validated voter data from CCES (2008–20) and Pew Research Center[30] (2016–20), Figure 17 plots the percentage-point difference between the share of white and nonwhite Democrats who are validated voters[31] and who reported voting for Democratic presidential, House, and Senate candidates. With the exception of Obama election years (especially 2008), these data indicate that white Democrats are consistently more likely than nonwhite Democrats to vote in presidential and congressional elections. Since 2008, in presidential races, these gaps have ranged from 6.6 points (2012) to 18.7 points (2020), with an average of 12 points; in Senate races, from 11.3 points (2012) to 17.5 points (2020), with an average of 13.6 points; and in House races, from 6.5 points (2012) to 18.4 points (2020), with an average of 14.1 points.
Figure 17
Racial disparities in Democratic voting behavior

The largest gaps have come in the two most recent elections (2018 and 2020), during a period in which rates of degree attainment among white Democrats jumped 12 points (from 44% in 2016 to 53% in 2018 and 56% in 2020). Figure 18 further shows that, between 2016 and 2020, the college-educated white share of voters for Democratic candidates increased by an average of 9.3 points across races, making them the largest single Democratic voting constituency in the 2018 and 2020 (and likely future) elections. While the college-educated nonwhite share (solid light blue line) also grew in this period (by an average of 7.2 points), a substantial portion of this growth is attributable to Asians, whose rates of educational attainment exceed those of whites. Indeed, excluding Asians (solid gray line), the college-educated nonwhite share grew by a more modest average of 5.6 points.
Figure 18
Racial and educational composition of validated Democratic voters
Clearly, racial disparities in voter turnout are not solely a function of socioeconomic differences. The Obama election years demonstrate the relevance of campaign and candidate-related factors for generating enthusiasm among the party’s nonwhite base. The problem, though, is that socioeconomic differences are relatively constant, whereas the factors that boost nonwhite turnout are transient and may not be operative from one election to the next. White Democrats, therefore, as a result of their higher general political engagement—which is linked, in turn, to higher education and socioeconomic status—have a higher turnout baseline: turnout for white Democrats depends less on the presence of inspirational candidates or campaigns (unless they’re Republicans of course). White Democrats are also more motivated by ideology than their nonwhite co-partisans, which increases the perceived stakes of any election.[32] Accordingly, even if pedestrian in-party candidates are on the ballot, they’ll still turn out to vote for them—lest the opposing ideological side gain ground.
General Discussion
The Democratic Party’s coalition has undergone a relatively recent and rapid demographic transformation; although the party is more nonwhite than ever before, a far greater proportion of the whites who have remained in (or have newly aligned with) the Democratic Party are college-educated and thus have more wealth and socioeconomic status.
This report has argued that this realignment of college-educated whites with the Democratic Party threatens to exacerbate enduring socioeconomic disparities between white and nonwhite (non-Asian) Democrats. To the extent that that higher socioeconomic status promotes higher levels of political engagement, this trend, if it continues, risks enlarging disparities in various forms of political participation and, ultimately, in political influence. Indeed, through the effective replacement of less educated with college-educated whites, white Democrats are able to sustain, if not grow, their (over)representation among politically active Democrats even as their share of the party steadily declines.
But as white Democrats increasingly punch above their political weight, nonwhite racial/ethnic groups that were long expected to be the face of the future Democratic Party—namely, African-Americans and Hispanics—continue to punch below theirs. Not all the reasons for this are socioeconomic. Political interest, efficacy, and enthusiasm certainly matter—as do the campaign and candidate-related factors that promote them. However, many of these and other variables also substantially overlap with socioeconomic status and cognitive ability. As long as these groups meaningfully trail whites on the latter, such groups will forever carry more political “dead weight”—politically disengaged, ineffective, or apathetic constituents—than white Democrats and will never achieve political influence commensurate with their size.[33] Nor will they be able to challenge white Democrats’ enduring hegemony over campaign donations, which are an important means through which individuals can influence the selection of election candidates as well as the agenda and legislative behavior of elected officials. Nonwhite Democratic candidates and legislators will thus continue to remain heavily reliant on white benefactors and, by virtue of this, susceptible to their influence.
What might be the consequences of these trends for the representation and power of nonwhite groups within the Democratic Party? Any prediction would be speculative—and would ultimately require assuming that educational polarization among whites will persist or continue to strengthen in the years and elections ahead. There are reasons to doubt this assumption. As we saw, the largest and most recent growth in this alignment—as well as concomitant increases in white Democrats’ political engagement—was spurred by the Trump election and presidency. Once Trump is no longer perceived as the bugbear face of the Republican Party, perhaps threat perceptions will fall, depolarization will ensue, and the stigma that college-educated whites attach to voting for GOP candidates will wane.
But there are compelling reasons to think that these trends will endure. First, they have endured through the time of this writing—just after the 2022 midterm elections and nearly two years into the first term of the Biden administration. For instance, preliminary data from the 2022 Cooperative Election Study show that 58% of white, college-educated, likely voters intended to vote for Democratic House candidates at rates similar to, if not higher than, those in the 2018 (57.6%) and 2020 (57%) elections.[34] Likewise, exit poll data, shown in Figure 19, suggest that college-educated whites voted for Democratic House candidates in 2022 at rates (50%) similar to those in 2020 (49%) and 2018 (53%).
Figure 19
Trends in exit poll data of white voters in House elections

Second, while anything is possible, it’s hard to envision a realistic scenario (at least in the foreseeable future) in which educational polarization reverses and college-educated whites gravitate back toward the Republican Party in meaningful numbers. Unless or until the Republican Party abandons, or at least moderates, its social and cultural conservatism, its appeal to college-educated whites will be limited. Additionally, and especially for younger college-educated whites, the Trump presidency may have been a period of important political socialization, in which an association of the Republican Party with anachronistic and anti-democratic ethnonationalism deepened or crystallized.[35] Barring a complete makeover of the Republican Party brand, this association is likely to stick with them in the years and decades ahead, if not for the rest of their lives.
Only time will tell, of course. But if the alignment of college-educated whites with the Democratic Party is here to stay, how will it affect the agenda of, as well as the balance of power within, the Democratic coalition going forward?
On some issues, these disparities may not matter because the attitudes and priorities of white Democrats closely approximate those of their less politically active nonwhite counterparts. For example, due to “Great Awokening,” the views of white and nonwhite Democrats have largely converged on racial issues.[36] This was a relatively recent development, but if it holds, racial policy will be one issue dimension on which nonwhite racial justice activists can extract support from white Democrats for their policy objectives. In return, white Democrats will receive greater nonwhite support for their preferred candidates or broader policy agenda—without which they would have little chance of prevailing at the ballot box.
Yet the political preferences and priorities of white and nonwhite Democrats (to say nothing of nonwhites in general) will also inevitably and perhaps increasingly diverge—if only because individuals of higher socioeconomic status are more socially progressive and are more likely to prioritize post-material or moral-value-related issues (e.g., abortion, climate change, LGBT rights) over kitchen-table issues. Thus, when asked to indicate the single most important issue that would influence their vote in the 2022 midterm elections, a recent ABC News/Ipsos poll shows that white Democrats (34.6%) were approximately three times as likely as nonwhite Democrats (11.5%) to select “abortion” or “climate change,” while nonwhite Democrats (44.5%) were nearly twice as likely as white Democrats (25.6%) to select the economy, inflation, gas prices, taxes, or crime.[37]
It is in these areas—those where the sensibilities of white and nonwhite Democrats differ—that these gaps between the two groups will likely be manifest. The former group’s higher levels of political attention, sophistication, and participation afford them the ability to exercise outsize influence over the selection of leaders, as well as the issues that are given priority and the rhetoric used to talk about those issues. This isn’t to say that white Democrats will always get their way or that they are capable of single-handedly dictating outcomes but only that they have a better chance than their numbers alone would suggest.
One risk of such a divergence is that the stronger and better-funded political voice of white Democrats will distort the perceptions of party leaders and candidates as to the popularity and importance of certain issue positions—not only to the electorate as a whole but even to the majority of the Democratic base. This is how you get Democratic elites and candidates aping progressive gender ideology and calling mothers “birthing people.” And it’s also why, in a midterm election season defined by inflation, crime, and the economy, they spent so much time speaking to abortion rights, January 6, and “threats to democracy.” They do so not because such issues are of paramount importance to nonwhite Democrats but rather to the educated white liberals who lobby them, fund their campaigns, predominate over partisan social media discourse, and are most likely to vote.
The result of this phenomenon is the selection of candidates who are—or who are pressured and incentivized to be—far more socially progressive than would be the case with proportional constituent input, as well as legislative time and energy being expended on niche progressive causes, programs, and amendments that are likely to polarize the chambers and produce congressional gridlock. There are also opportunity costs: the more time invested in debating and attempting to pass progressive legislative agendas, the less time that can be spent on “normal” economic and quality-of-life issues that are far more relevant to the lives of many working-class nonwhite Democrats.
The greater political clout of white progressives is likely to have a chilling effect on the expression and representation of dissenting policy attitudes. Especially by virtue of whites’ hegemony among Democratic donors, fear of activist backlash may discourage moderate voices within the party from forcefully discussing certain social issues (e.g., rising crime levels) or advocating policies (e.g., increasing the number of police on the street, increasing border security) that run afoul of progressive moral ideology. Thus, once again, the policy views of educated whites will enjoy greater purchase than those of working-class nonwhites.
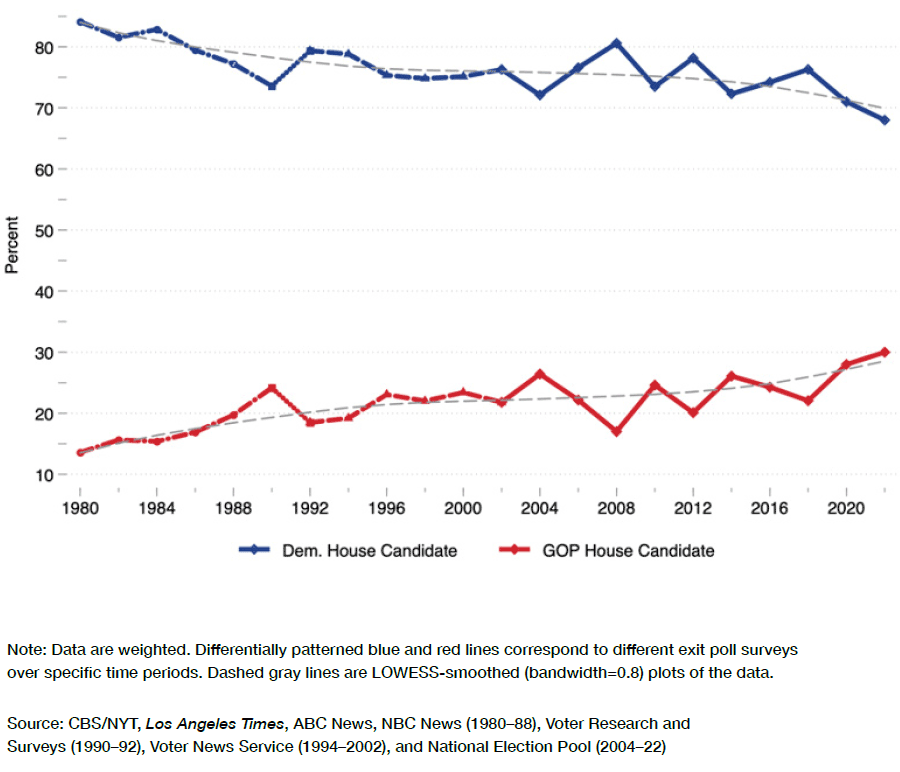
Certainly, this does not mean that nonwhites are destined to abandon the Democratic Party and vote for Republican candidates en masse anytime soon. However, the less Democratic Party elites speak to kitchen-table issues, and the more they mimic the language and speak to the policy priorities of college-educated white progressives, the harder it becomes to maintain the traditional “party of the working class” brand, and thus the easier it becomes for at least an electorally meaningful subset of working-class nonwhites to reconsider their political allegiances or decisions at the ballot box. There are signs that such defections are already under way. As shown in Figure 20, 30% of “voters of color” reported voting for a Republican House candidate in 2022, which is the highest figure ever recorded in any exit poll since at least 1980.
Figure 20
Trends in exit poll data of nonwhite voters in House elections
Whether Republicans can capitalize on and sustain or further such shifts will likely turn on their ability to credibly market the party as a racially/ethnically inclusive, nationalist, economically moderate,[38] socially conservative, and “saner” alternative to a white progressive-dominated party. Given their steep losses among college-educated whites, the survival, or at least the future electoral competitiveness, of the party may depend on it.
About the Author
Zach Goldberg is a Paulson Policy Analyst who recently completed his PhD in political science from Georgia State University. His dissertation focused on the “Great Awokening”—closely examining the role that the media and collective moral emotions played in recent shifts in racial liberalism among white Americans. At MI, his work will touch on a range of different issues, including identity politics, criminal justice, and understanding the sources of American political polarization. Some of Goldberg’s previous writing on identity politics in America can be found at Tablet and on his Substack.
In the summer of 2020, Goldberg joined MI President Reihan Salam, Columbia University Professor Musa al-Gharbi, and Birkbeck College Professor and MI Adjunct Fellow Eric Kaufmann for a conversation on the “Great Awokening”—the strong leftward shift among white liberals on issues of racial inequality and discrimination, immigration, and diversity that has been taking place since 2014.
Appendix
Please see the online appendix available here.
Endnotes
Photo: smartboy10/iStock
Are you interested in supporting the Manhattan Institute’s public-interest research and journalism? As a 501(c)(3) nonprofit, donations in support of MI and its scholars’ work are fully tax-deductible as provided by law (EIN #13-2912529).