New York's Economic Future Rides on Its Subways

New York City subway ridership has nearly doubled since its modern-day trough of 1977, when the subways carried 917.2 million riders, to the recent peak of nearly 1.8 billion in 2015. Yet subway ridership has not grown evenly across the city, nor has it grown fastest where jobs are concentrated. One commonality stands out among a myriad of contributors to the growth in subway ridership. As the number and share of New Yorkers in the labor force have grown, the number and share of those workers who rely on mass transit—especially the subway system—to get to their new jobs have also grown.
Areas including the lower-income neighborhoods in the South Bronx, Central Harlem, and northern Brooklyn have regained or exceeded their population lows in the late 1970s. The new populations are more likely to be employed than residents one or two generations ago—and they would be unable to get to their jobs if it were not for a reliable transit system. Likewise, the city’s booming service sector, including its hospitality industry, could not succeed were it not for its access to this labor pool.
Beginning in the 1980s, New York rebuilt its transit infrastructure. As a result, there was much extra capacity on subway trains in the next few decades to absorb new workers as the city’s population grew toward its mid-20th-century peak. Today, though, New York has no such extra capacity. Indeed, overall city ridership has declined slightly since 2016, because the trains—particularly for outer-borough commuters heading for destinations in Manhattan at peak hours—simply cannot fit more people.
To protect the economic and social gains that have been made in the last several decades—and secure the future of the economy—state and city elected officials and policymakers will have to invest, and invest wisely, in additional subway, bus, ferry, and other transit capacity. Otherwise, they risk presiding over stagnant job growth and workforce participation that is independent of any cyclical recession.
This report is the third in a series on New York City transit. Find part 1 and part 2.
Introduction
New Yorkers are aware that subway ridership has soared in recent decades, nearly doubling between its modern-day trough in 1977, when 917.2 million people took the train, to its recent peak of nearly 1.8 billion in 2015[1]. But they may not be aware of one of the biggest identifiable reasons that it has soared. New York’s once-poorest neighborhoods, where joblessness and estrangement from the working world was the norm, have added record numbers of people to the labor force since 1990, and these new lower- and middle-income workers are disproportionately dependent on the subway system to get them to and from work.
To be sure, many factors have contributed to subway growth in the modern era. As crime has declined since the early 1990s, the city’s population has grown to a record high, from 7.1 million in 1980, the city’s nadir, to 8.6 million people today.[2] New York’s economy has thrived over the past four decades, with private-sector jobs reaching a peak of 3.9 million this March, up nearly 40% from 2.8 million in 1980.[3] Tourism has steadily broken records each year since the 1990s, with 62.8 million visitors in 2017, well more than double the 25.3 million people who came in 1990, adding to ridership.[4]
Finally, starting in the 1980s, New York invested billions of dollars in public money to rebuild its deteriorated transit infrastructure, inviting more riders with more reliable service.[5] In 1998, the introduction of the unlimited-ride monthly MetroCard enabled New Yorkers to increase their usage of this sturdier system without paying extra money per trip.
Yet subway ridership has not grown evenly across the city, nor has it grown fastest where jobs and tourism are concentrated. One commonality stands out among a myriad of contributors to growth. As the number and share of New Yorkers in the labor force have grown, the number and share of those workers who rely on mass transit—especially the subway system—to get to where the jobs are have also grown.
New York City’s economy has been an outstanding success story in modern times, not only by creating jobs for the tristate region but by creating jobs for residents across the five boroughs. In particular, the growing populations of many lower-income neighborhoods in the Bronx, Brooklyn, and Central Harlem are more likely to work at a payroll job than residents one or two generations ago. And they would be unable to get to where the jobs are were it not for a reliable transit system. Likewise, New York’s booming service sector, including its hospitality industry, could not succeed were it not for its access to this labor pool.
The subways, then, are both a cause and an effect of New York’s labor-market boom. Without subways, New Yorkers would not have such a wide choice of employment options, and without such employment options, New Yorkers would not be taking the subways. All these factors work together to culminate in the crowds of recent years on the subway. New York has a record-high population. A record-high percentage of that population is working or seeking work. And a record-high percentage of that working population relies on mass transit for commuting to work. (Please see the Appendix for the sourcing and methodology for research presented in this paper.)
Behind the Growth in Subway Ridership
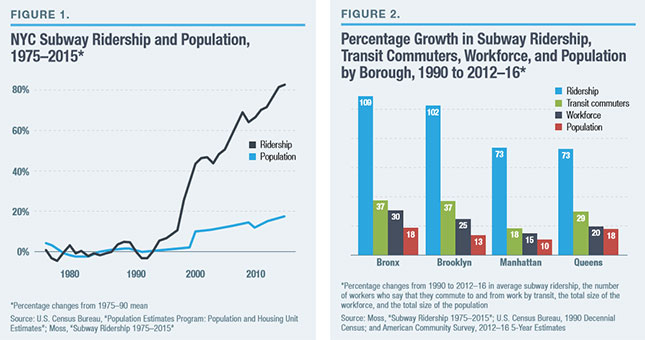 Between 1990 and 2016, subway ridership skyrocketed, but population growth does not explain that increase (Figure 1). Growth in the city’s population (excluding Staten Island, which has no subway service) was 15%. Growth in subway ridership, however, was nearly 82%.
Population as a driver of ridership is even weaker at the borough level (Figure 2). It’s no surprise that subway ridership in Manhattan grew at seven times the rate of population growth, as tourism and job creation remain concentrated in Manhattan. Yet ridership in Brooklyn grew by an even bigger multiple of population growth, at nearly eight times. The Bronx had both the highest rate of population growth and the highest rate of ridership growth, at 18% and 109%, respectively. Yet Queens grew almost as fast as the Bronx in terms of population, with a far lower rate of ridership growth.
What, then, has driven subway ridership? A big part of the answer is the growth in the city’s workforce. Though the city’s overall population has grown 15% since 1990, its overall workforce has grown by 22%. In the Bronx and Brooklyn, though, the city’s workforce grew at much faster rates. The Bronx is the most extreme example. In 1990, the workforce in the Bronx was 505,900. As of the period between 2012 and 2016, it was 659,800, a 30% increase, nearly twice the borough’s relative population growth. In other words, as the Bronx has repopulated itself following the 1970s destruction of housing and flight to the suburbs, it populated itself with people more likely to work. The same is true of Brooklyn, where the workforce has grown by 25%, from 1,038,100 people in 1990 to 1,294,400 people by 2016.
As more people in both the Bronx and Brooklyn have gone to work, an increasing share of them rely on the subway to get to and from their jobs. In 1990, 56.6% of Bronx workers took public transportation to work; by 2016, 60.2% did. In Brooklyn, 58% of workers took public transit to work in 1990; by 2016, 61.8% did.
The raw numbers of subway commuters alone are remarkable. Since 1990, the number of people commuting to work from or within the Bronx via public transit, mostly on subways, has increased by nearly 94,000 people. The number of people commuting on transit from or within Brooklyn has increased by 193,000 people. By contrast, the number of commuters originating in Manhattan grew by 78,000 people over the same period.
The high percentage of Manhattan residents who walk to work can partly explain this discrepancy: 21%, compared with 8% and 9% in the Bronx and Brooklyn, respectively. This disparity, of course, points up how the city’s less affluent outer-borough workforce acutely relies on public transit. A resident of the South Bronx or northern Brooklyn cannot walk to work and enjoy the same variety of job choices that a resident of lower or midtown Manhattan can.
A Bronx Tale—and More
People who live in affluent neighborhoods where large percentages of the population have historically worked in the payroll economy are not driving the city’s transit growth. Rather, people who live in less wealthy neighborhoods—where workforce participation, once and often still low, has surged as a percentage of the population—are driving that growth. A closer look at some of the city’s neighborhoods illustrates just how much New York’s new and growing working and middle class depend on mass transit.
Melrose and Mott Haven vs. Battery Park City and Lower Manhattan
Melrose, Mott Haven, Hunts Point, and Longwood (Bronx Community Districts [CDs] 1 and 2) are New York’s poorest neighborhoods, with median household income of $23,100, up from $12,900 in 1990. These areas in the South Bronx are vastly different from the way they were in the 1970s. The population has grown by 38%, from 116,500 in 1990 to 161,300 in 2012–16. As late as 1990, fewer than half the adults in the area worked, with a labor-participation rate of 44%. Today, the area’s labor-force participation rate is 50%—still the city’s lowest, but a tremendous improvement. An increasing percentage of this working population also relies on subways to get them to and from work. In 1990, 65% of the local workforce commuted via public transit, mostly subways; by 2016, the figure was nearly 70%.
The cumulative effect of population growth, workforce growth, and growing dependence on transit for commuting purposes is clear. The number of people commuting on public transit to work from these South Bronx neighborhoods, mostly via subway, has more than doubled since 1990, from 17,500 to 35,600.
By comparison, lower Manhattan (Manhattan Community Districts 1 and 2) is home to some of the city’s wealthiest workers, with median annual household income of $124,400. The neighborhoods are similar in size and recent population to the South Bronx. In 1990, 119,400 people lived in Battery Park City, Tribeca, and Soho. By 2016, 155,500 lived in these areas, for a 30% growth rate. In 1990, 50% of these workers took public transportation to work; by 2016, 53% did. Yet population growth and a growing dependence on transit haven’t translated into soaring subway-ridership numbers. The number of people taking transit to work regularly has increased from 39,300 in 1990 to 51,200 by 2016, or 30%, compared with the South Bronx’s more than 100% growth.
Behind the difference in subway-ridership growth in these neighborhoods is residents’ participation in the workforce, which has not grown in lower Manhattan as it has grown in the South Bronx. Since at least 1990, these lower Manhattan neighborhoods have boasted the city’s highest workforce-participation rates. Back then, 75% of adults worked. Because the percentage of people working has not grown and because such a high percentage of residents walk to work—27%, versus 10% in the South Bronx—the number of people taking public transportation from these neighborhoods has not grown as much.
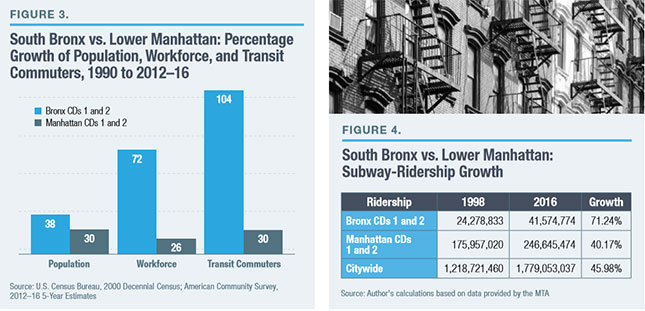 In both the South Bronx and in lower Manhattan, population has grown (Figure 3). Only one area, though, has experienced extreme growth in both workforce participation and transit-commuting population, and thus, in subway ridership. Without a functional subway system, the growing number of workers who live in the South Bronx could not have reached a record number of jobs.
This difference is reflected in ridership originating at stations within each area (Figure 4). In the South Bronx, between 1998 (the first year for which the MTA made station-level data available) and 2016, ridership grew by 71%, far faster than the city as a whole during that period. In lower Manhattan, ridership grew at 40%, slightly below the city’s overall rate.
Bushwick vs. Midtown Manhattan
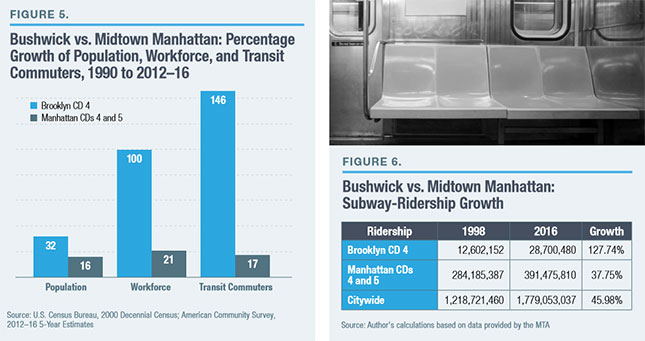
The Bushwick neighborhood, in northern Brooklyn, and the residential neighborhoods of midtown Manhattan show another contrast (Figure 5). Like the South Bronx and lower Manhattan, Bushwick (Brooklyn CD 4), another historically poor area, has grown quickly in recent decades, from a population of 103,000 in 1990 to 135,800 in 2016. In 26 years, the number of residents in the workforce has more than doubled, from fewer than 37,800 people to 75,800. The labor-force participation rate, too, has grown, from 54% to 69%.
 Bushwick’s residents, new and long-term, could not have entered the workforce in such numbers were it not for the subway—most famously, the L train, which carries people into midtown Manhattan. The number of people whose transit commute starts in Bushwick has increased by a whopping one and a half times since 1990. Bushwick’s median household income has increased as well, from $21,000 to $42,000.
By contrast, midtown Manhattan has grown without such extreme reliance on the subway, despite the fact that the area is saturated with subways. Manhattan CDs 4 and 5 are home to 149,300 people in 2012–16, up from 128,400 in 1990, a 16% growth rate. The area is wealthy, with a median household income of $100,000. Yet these neighborhoods, like lower Manhattan, with a preexisting high workforce-participation rate, haven’t seen their resident workers grow in numbers or percentage at anywhere near the pace of Bushwick. Midtown Manhattan’s resident workforce has grown by 21% since 1990; its labor-force participation rate, at 76%, is up from 73%. The number of people who rely on transit to get to work has grown even less, at 17%. Just as in lower Manhattan, the fact that 34% of people can walk to work makes a big difference; in Bushwick, only 8% of commuters can do so.
These contrasts, too, show up in a comparison of ridership data since 1998 (Figure 6). Midtown Manhattan is home to some of the busiest subway stations in the city and is the center of the city’s tourism industry. Yet ridership originating in stations within midtown Manhattan has lagged that of Bushwick, where ridership has more than doubled since 1998.
Central Harlem vs. Sunnyside, Queens
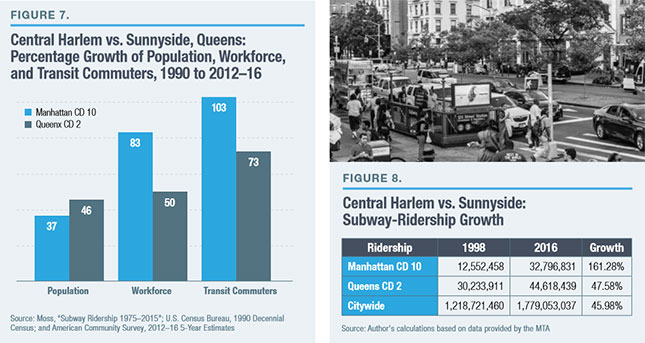
Like the South Bronx and Bushwick, Central Harlem (Manhattan CD 10) has long been a poor area with a historically low labor-force participation rate: 50% in 1990, with a median household income of $17,300. Its population has grown by 37%, from 99,200 in 1990 to 136,000 in 2012–16. Its workforce population has increased at a far greater rate, by 83%, from 38,300 to 72,000 people. Central Harlem’s labor-force participation rate is now 64%.
 A growing number of workers in CD 10 are, accordingly, dependent on mass transit: 22,100 back then, and 44,900 today. Without reliable subway service, these new workers would not have comparable job options as those available in midtown and lower Manhattan. Median income in Central Harlem has risen to $40,800.
Sunnyside, Queens (Queens CD 2), has grown in population at a faster rate than Central Harlem, from 95,400 residents in 1990 to 139,100 today, or by 46% (Figure 7). Unlike lower and midtown Manhattan, Sunnyside has long been middle class, with a median income of $60,100 today, up from $38,100 in 1990. Yet like lower and midtown Manhattan, Sunnyside has always had a high labor-force participation rate, up from 66% in 1990 to 69% in 2012–16. While its workforce has also grown, it hasn’t soared as fast; the number of workers who live in CD 2 is up from 53,400 in 1990 to 80,200 today (50%). The number of workers who live in the area and take mass transit to work has, accordingly, risen more slowly than in Central Harlem, whose workforce has swelled from 30,600 to 52,800 (73%).
The increased number of workers in both areas is high, but the disparate levels of reliance on the subway in both CDs are reflected in the station-level subway data since 1998 (Figure 8).
Conclusion
One fact becomes clear after a borough- and neighborhood-level analysis of New York’s growth in subway ridership. Beginning in the early 1990s, New York succeeded not only in growing its population but in growing its working population, particularly in its poorest areas. But it could do so only because it had spent the previous decade, the 1980s, rebuilding its transit infrastructure.[6] As a result, there was much extra capacity on subway trains to absorb new workers.
Today, New York has no such extra capacity. Indeed, overall city ridership has declined slightly since 2016, because the trains—particularly those bound for commuter destinations within lower and midtown Manhattan that originated in the outer boroughs—simply cannot fit more people.
New York’s mass transit system—especially its subways—has been a crucial factor for encouraging and enabling more of the residents in the city’s historically poorer neighborhoods to work. Any sustained deterioration in subway services endangers this success story. New York cannot help areas such as the South Bronx, for example, increase their workforce participation levels from what are still low figures (compared with the rest of the city) without increasing the mass-transit system’s ability to get yet more workers around within the city.
To protect the gains that have been made, and secure future gains, elected officials and policymakers at both the state and city level will have to invest, and invest wisely, in additional subway, bus, ferry, and other transit capacity. Otherwise, they risk presiding over stagnant job growth and workforce-participation growth that is independent of any cyclical recession.
Appendix
This paper rests on three relationships: between population growth and subway ridership; between workforce-population growth and subway ridership; and between the growth in the number of people who report that they rely on mass transit to get to work and subway ridership. Data on New York City population, workforce participation, and people who commute via mass transit are extracted from the U.S. Census. The number of people who commute via mass transit includes those traveling on buses. However, bus ridership has declined in recent years, and the vast majority of transit rides in the city—70%, as of 2016—are on subways.
Subway-ridership calculations are the author’s, based on data on annual subway ridership by subway station from the MTA that date back to 1998. The data were obtained through New York’s Freedom of Information Law (FOIL), and the author used a map to fit those data for each station into a community district. Some historical ridership data at the city and borough levels only are sourced from Mitchell L. Moss et al., “Subway Ridership 1975–2015,” New York University, Rudin Center for Transportation, March 2017.
The terminus for data sets (2012–16) is an average of subway-ridership data, to conform to the census format, which reports data on a five-year period, and thus allows for direct comparisons.
At the borough level, the relationship between population growth and ridership is the weakest of the three considered, with an r of 33%. (The r value in this and subsequent figures is the correlation coefficient, a measure of the linear relationship between two variables. The value of r varies from –1 to +1, from a perfect negative correlation, to no correlation at zero, to a perfect positive correlation.) The relationships between workforce-participation growth and ridership, as well as between commuting-growth and ridership, are much stronger, at 92% and 85%, respectively. At the community-district level, the relationships are weaker, but the relationship between population and ridership growth remains the weakest, at 16%. The relationship between workforce participation is stronger, in the medium range at 36%. The relationship between growth in commuting and ridership was slightly stronger, at 46%. Scatter-plots for the community-district-level data are below.
Many factors, as discussed in the text, contribute to subway-ridership growth, and many factors not discussed in detail in the text are impracticable to quantify: no reliable data exist, for example, on what percentage of tourists use the mass-transit system, how often, and where. Because of weakness in MTA station-level data, all statistical relationships at the community-district level consider the change from 2000 to the 2012–16 average. Borough-level relationships are from 1990 to the 2012–16 average.
Endnotes
- Mitchell L. Moss et al., “Subway Ridership 1975–2015,” New York University, Rudin Center for Transportation, March 2017.
- New York City, Department of City Planning, “Current Estimates of New York City’s Population for July 2017.”
- U.S. Bureau of Labor Statistics, “State and Metro Area Employment, Hours, and Earnings,” retrieved Apr. 20, 2018; and Federal Reserve Bank of New York, “New York City’s Economy in 1980,” FRBNY Quarterly Review, Spring 1981.
- City of New York, Office of the Mayor, “Mayor de Blasio and NYC & Company Announce New York City Welcomed Record 62.8 Million Visitors in 2017,” Mar. 30, 2018.
- Metropolitan Transportation Authority Permanent Citizens Advisory Committee, “The Road Back: A Historic Review of the MTA Capital Program,” May 2012.
- The Permanent Citizens Advisory Committee of the MTA (PCAC), “The Road Back: A Historic Review of the MTA Capital Program,” May 2012.
- New York City, Department of City Planning, “Population FactFinder”; 1990 and 2000 Census, Socioeconomic Profile Social Characteristics (by community district in each borough: Bronx, Brooklyn, Queens, and Manhattan).
- The sources for the scatter-plots come from MTA data obtained by the author; the U.S. Bureau of the Census 2000 Decennial Census; and the Bureau’s American Community Survey, 2012–16 5-Year Estimates.
______________________
Nicole Gelinas is a senior fellow at the Manhattan Institute and contributing editor at City Journal. Follow her on Twitter here.
Are you interested in supporting the Manhattan Institute’s public-interest research and journalism? As a 501(c)(3) nonprofit, donations in support of MI and its scholars’ work are fully tax-deductible as provided by law (EIN #13-2912529).