Education Savings Accounts: How ESAs Can Promote Educational Freedom for New York Families and Improve State and Local Finances

Many advocates are calling 2021 the “Year of Educational Choice.” Thus far, seven states, including Kentucky, Missouri, and West Virginia, added entirely new educational choice programs, while 11 other states have expanded already-operational programs.
One hallmark of the recent reform has been the remarkable expansion in education savings account (ESA) programs, which doubled this year. ESAs allow parents to withdraw their children from public district or charter schools and receive a deposit of public funds into government- authorized savings accounts. Families must use those funds for education but have a variety of options for how to do so, including private school tuition and fees, online learning programs, private tutoring, community college costs, higher-education expenses, and other approved customized learning services and materials. Because ESAs allow families to access a variety of educational options beyond schooling, they allow greater customization and flexibility for parents to educate their children.
While a substantial body of research exists to demonstrate the benefits that choice policies such as ESAs have on various student, family, community, and societal outcomes, the fiscal impact of these policies is also an important part of the debate. This report will examine solely the potential fiscal effects of educational choice programs on New York State taxpayers and district schools.
The fiscal effects of educational choice programs, and how those effects are distributed among taxpayers and school districts, depend on how they are designed. A program with broader eligibility and higher ESA value, for instance, will promote greater educational opportunity and innovation—but will cost more than a program with limited eligibility and lower ESA value.
This report presents fiscal models for two ESA amounts: one worth $6,500 (90% of the state’s average marginal per-pupil cost); and the other worth $9,900 (100% of the statewide average amount of total per-pupil state aid). For both scenarios, the models estimate the net fiscal effect of the program, which is the difference between the cost of the ESA program and the savings from “switchers”—that is, students who would have remained in a public school system if not for the program.
For an ESA worth $6,500 and the likely scenario that 1% of eligible students participate in the program:
- If at least 90% of participating students are switchers, the ESA program would generate net savings for the state estimated up to $19 million (or $700 per ESA student). Switcher rates below 90% would generate net costs worth up to $39 million (or $1,400 per ESA student).
- Local districts would experience between $197 million and $282 million (or $7,400–$10,500 per ESA student) in net variable savings.
- Combining these results implies that New York taxpayers overall would experience between $158 million and $301 million in short-run net fiscal benefits (or $5,900–$11,200 per ESA student).
For an ESA worth $9,900 and the likely scenario that 1% of eligible students participate in the program:
- The ESA program would generate net costs for the state estimated between $73 million and $131 million (or $2,700–$4,900 per ESA student).
- Local districts would experience between $197 million and $282 million (or $7,400–$10,500 per ESA student) in net variable savings.
- Combining these results implies that taxpayers overall would experience between $94 million and $236 million in short-run net fiscal benefits (or $3,500–$8,800 per ESA student).
The distribution of these fiscal effects will vary significantly across school districts. All but 15 school districts would experience net fiscal benefits if students leave to participate in an ESA program (or if students choose to leave for any other reason). For these districts, estimated short-run variable costs per student exceed the estimated reduction in state aid per student. Thus, districts can reduce their costs by an amount that matches or exceeds its reduction in state aid payments when enrollment decreases. The remaining 15 school districts may incur a negative net fiscal impact in the short run, but will eventually be able to fully adjust for reduction in revenue for a given decrease in enrollment.
Some are concerned that choice programs like ESAs will harm public schools and their students. But research has repeatedly shown that students who remain in public schools also make gains on test scores, on average. Indeed, as this report demonstrates, ESAs will provide fiscal benefits for the school system, meaning that students who remain in public schools generally end up with more resources on a per-pupil basis. The Empire State can be confident in expanding educational opportunities without adverse effect to its bottom line.
Introduction
This paper discusses the potential fiscal effects of education savings accounts for K–12 in New York on the state and local taxpayers.
A Wall Street Journal editorial deemed 2011 the “Year of School Choice.” [1] At the time of publication, 13 states had passed choice legislation. One decade later, efforts to expand educational opportunities for families has enjoyed such legislative successes that some have dubbed 2021 as the “Year of Educational Choice” (See Sidebar, “Types of Educational Choice Programs”). [2] Thus far, seven states, including Kentucky, Missouri, and West Virginia, added entirely new educational choice programs, while 11 other states have expanded already-operational programs.
The recently enacted programs have also improved in both quality and scope. In particular, the number of education savings account (ESA) programs doubled this year. ESAs allow families of eligible children to withdraw their children from public schools and receive government funds for preapproved educational goods and services. [3] Because ESAs allow families to access a variety of educational options beyond schooling, they allow greater customization and flexibility for parents to educate their children.
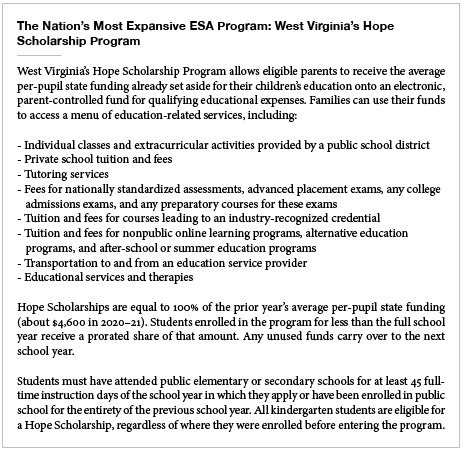
Bills passed this year are also more expansive in terms of student eligibility and funding. West Virginia’s new ESA program has the broadest eligibility of any in the nation—94% of students are eligible statewide (See Sidebar, The Nation’s Most Expansive ESA Program: West Virginia’s Hope Scholarship Program”). [4] Indiana expanded its voucher program by increasing the income eligibility threshold to 555% of the federal poverty level (FPL). Other programs also include middleclass families, with several states, such as Kentucky, Missouri, New Hampshire, and Florida, introducing or expanding programs to allow low- and middle-income families to participate. [5]
Educational choice enjoys broad support among adults. According to a May 2021 report from EdChoice, 67% of adults support ESAs while 59% and 63% support school vouchers and charter schools, respectively. [6] Notably, this support is not driven by conservatives alone. Choice is a bipartisan issue—indeed, there is a slightly higher level of support for ESAs among Democrats (73%) than Republicans (68%).
A substantial body of research demonstrates the benefits that choice policies have had on various student, family, community, and societal outcomes. [7] Debates about choice, however, often boil down to the cost of such programs. Because policymakers are tasked with balancing states’ budgets, they must be concerned with the fiscal effects of educational choice programs. As such, this paper considers solely the potential fiscal effects of educational choice programs on New York State taxpayers and district schools.

Fiscal Analyses of Educational Choice Programs
There have been 70 analyses of the fiscal effects of educational choice programs currently operating in the United States. These fiscal analyses, which account for programs’ costs and savings, account for 3 ESA programs, 24 voucher programs, and 18 tax-credit scholarship programs in 23 states and D.C. Of these studies, 65 found that programs generated net savings for taxpayers, 4 found that programs were cost-neutral, and 5 found that programs generated net costs. [8]
These analyses include a recent national study of the fiscal effects of 40 educational choice programs on state and local taxpayers combined. [9] Through FY 2018, these programs generated net fiscal benefits estimated between $12.1 billion and $27.8 billion (or $3,200–$7,400 per student participant). In other words, these programs generated $1.80–$2.80 in fiscal savings for each dollar spent on these programs, on average. The present analysis employs methods used in this study.
There has also been research on the potential fiscal effects of various ESA models in two of New York’s neighboring states, Connecticut and New Jersey. [10] In Connecticut, an ESA program that provides $5,000 of funding to each student would produce overall net fiscal benefits for state and local taxpayers estimated up to $385 million. [11] In New Jersey, an ESA that provides $6,500 of funding would produce net fiscal benefits for state and local taxpayers estimated up to $958 million. [12]
Overview of New York State Funding for the Public School System
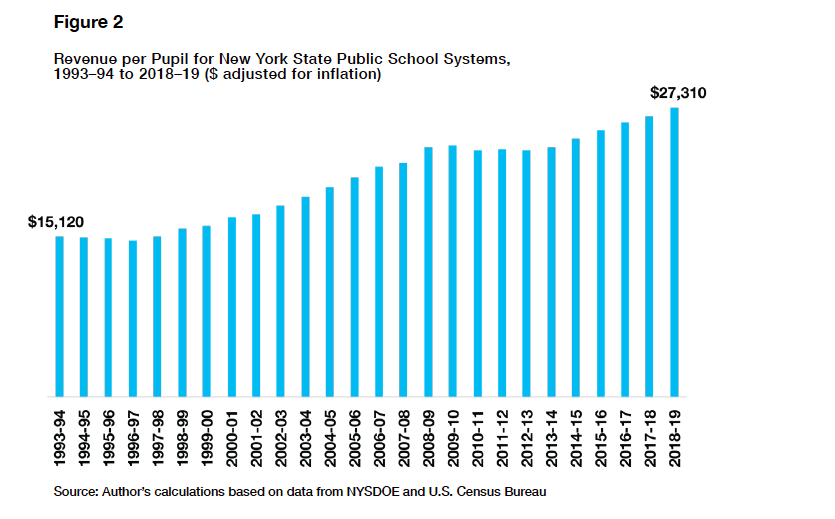
In 2018–19, New York State public schools received nearly $75 billion in total revenue, or $27,310 for each PK–12 student. [13] Public school districts receive funding from local, state, and federal sources (Figure 1). Local revenue (57% of total revenue) mostly comes from local property taxes. State revenue (39% of total revenue) derives from state taxes, such as income and sales tax. The remaining 4% flows from the federal government.

Based on data from the New York State Dept. of Education (NYSDOE), inflation-adjusted funding for public school systems between FY 1994 and FY 2019 increased from about $15,000 in FY 1994 (in 2019 dollars) to more than $27,000 per student, or by 80% (Figure 2). Thus, resources devoted to funding NYS’S public school systems has increased an average of 3.2% year over year, after netting out inflation.
The way in which funding for K–12 education changes when enrollment fluctuates is complex. It is governed by dozens of aid formulas that specify how funds are allocated to New York school districts. These funds can be divided into three broad categories:
- Aid based on pupil counts: funds based directly on the number of students enrolled in a district and their backgrounds and needs
- Reimbursement aid: funds that flow to districts for capital, transportation, and other aidable expenses not based on student enrollment
- Building aid: funds for construction and financing of approved building projects
Reimbursement aid and building aid are not based on the number of students. Therefore, only the first category is relevant for estimating the potential fiscal effects of an educational choice program on state and district budgets.
A portion of funds generated by state aid is largely determined by student enrollment and need. New York State has a foundation-based funding formula, meaning that public school districts receive a base amount for each student plus add-on funds for students with certain needs or from certain backgrounds. Here’s how it works.
First, the state specifies an amount, called the Adjusted Foundation Amount, which comprises state and local contributions. The Total Adjusted Foundation Amount may be adjusted based on certain factors, which are specified in a calculation known as Foundation Aid Payable. Then the state determines how much the district can contribute (known as the Expected Minimum Local Contribution). The state’s contribution equals the gap between the Foundation Aid Payable and the local contribution.
To estimate the amount of revenue reduced when students leave a district to participate in a choice program, the present analysis uses the portion of state aid per student based on student enrollment. [14] On average, about 74% of state aid is based on students. State aid for the following categories is closely based on students: foundation aid, public high-cost excess cost aid, private excess cost aid, textbook aid, computer software aid, library materials aid, and computer hardware and technology aid. [15]
Total average state aid for FY 2019 is about $9,900 per student. Of this amount, $7,200 is based on students, on average. [16] State aid per student varies considerably by district and ranges from $1,300 to about $25,000 per student. [17] Therefore, the fiscal effects incurred when students leave public schools for any reason are not evenly distributed across districts.
Methods for Measuring the Fiscal Effects of Choice Programs
Before conducting the fiscal analysis for an ESA program in New York, it is necessary to specify how costs and savings will be measured. There is a cost to taxpayers for ESA programs in the form of payments for ESAs. There is also a savings from ESA programs in the form of money not spent by public schools on students who do not enroll in a public school because of the ESA. These students—those who otherwise would have enrolled in a public school—are known as switchers. The net fiscal effect (NFE) of an ESA program is captured by the following relationship:
NFE = [cost reduction from switchers] – [cost of ESA program] [18]
These fiscal effects, however, are distributed across different parties. As such, rather than simply presenting one overall NFE for the program, this report attempts to isolate the fiscal effects on state taxpayers and local taxpayers.
State Fiscal Effect
NFE on state taxpayers (NFE_state) is explained by the following:
NFE_state = [state savings from switchers] – [total state cost of ESA program]
While the state incurs the full cost of an educational choice program, it simultaneously incurs a fiscal benefit from supporting fewer students in the public school system due to the choice program. The equation above not only accounts for the total cost of the choice program for all student participants, but it also accounts for state savings from students switching from the public school system into the choice program. Thus, an important factor for a fiscal analysis is the switcher rate, discussed later in this section.
Local Fiscal Effect
NFE on local taxpayers and public schools (NFE_local) is explained by the following:
NFE_local = [short-run variable cost savings from switchers] – [reduction in revenue from switchers]
where variable costs are costs that change when enrollment changes. Because choice critics often claim that choice harms public schools by decreasing revenue after students leave, some may be concerned with the local fiscal effect.
Fiscal benefits for local taxpayers may or may not materialize as direct reductions in their tax bills. Local governments could choose to reduce taxes, but this is often not the case. [19] If localities do not reduce property taxes when educational costs decrease, school districts will end up with more resources for the fewer students remaining in public schools.
The present analysis uses categorical school expenditure data from the National Center for Education Statistics at the U.S. Department of Education. Estimates are based on the following three categorical expenditures: instruction, instructional support services, and student support services. This approach considers as fixed costs all other expenditures, such as capital outlay, maintenance, debt service, transportation, food service, transportation, school and district administration, and numerous other categories. Because some of these categories can be considered variable or quasi-variable in the short run, this approach is cautious. Notably, this approach is more cautious than methods used by some economists. [20]
To derive estimates for short-run variable costs, I first use federal data to estimate the percentage of total costs that are variable in the short run. I then apply these rates to the most recently available cost data reported on NYSDOE’s website. On a statewide per-pupil basis, the estimated shortrun variable cost for New York public schools is about $18,800 per student, or 65% of total cost.
 Combined Fiscal Effect
The net combined fiscal effect on state and local taxpayers (NFE_combined) is captured by the following:
NFE_combined = [short-run variable cost savings from switchers] – [total cost of ESA program]
Because taxpayers pay both state and local taxes, some individuals will be interested in estimates for combined state and local NFEs.
Switcher Rates
The switcher rate is an important factor in fiscal impact calculations for choice programs because these students represent both cost and savings. Switchers are students who would have enrolled in public school systems without financial assistance from the choice program. [21] Non-switchers are students who would have enrolled in a nonpublic school setting, such as a private school or home school, without financial assistance from the choice program. From a financial perspective, non-switchers represent a pure cost for choice programs.
Many factors can affect switcher rates, such as the amount of funding provided for families and program eligibility rules, and these vary considerably across programs currently in operation. Some programs restrict eligibility based on income and special needs. Some programs require students to have been enrolled in a public school prior to participating in a choice program. Some programs with prior public school enrollment requirements allow exceptions to this requirement (e.g., kindergarten students, students from military families, and students in foster care). The level of funding and options available can affect families’ decisions to participate.
Some of the recently adopted and expanded choice programs are open to non-switchers. For example, New Hampshire’s ESA program is open to families with annual household income up to 300% of the federal poverty level ($79,500 for a family of four in 2021) and does not have a prior public school enrollment requirement. [22] To participate in West Virginia’s ESA program, students must have attended public K–12 schools for at least 45 full-time instruction days or have been enrolled in public school for the entire previous school year. All kindergarten students, however, are eligible for West Virginia’s program. [23]
Table A in the Appendix summarizes prior public enrollment requirements for 40 educational choice programs. [24] At least 21 choice programs do not have any prior public enrollment requirements, including 2 ESA programs in Florida and Mississippi; 8 voucher programs in D.C., Ohio, Utah, and Wisconsin; and 11 tax-credit scholarship programs in nine states.
Of 19 programs with prior public enrollment requirements, 16 have exceptions to those requirements. These exemptions vary significantly. For example, Arizona’s ESA program is open to all kindergarten students, foster care students, students residing on Native American reservations, and students from active military families. The Racine (Wisconsin) Parental Choice Program exempts students not enrolled in a school the previous year plus students in kindergarten, first grade, and ninth grade. In some programs, students from failing public school districts are exempt from prior public enrollment requirements.
These complexities can make it difficult to estimate the switcher rate for a hypothetical new program, but a body of research sheds light on the question. Lueken (2020) analyzed data from random assignment studies conducted in programs that were mostly restricted to low-income families, some of which had prior enrollment requirements, and some of which did not. It estimated a range for switcher rates of 84%–90%. [25]

Break-Even Switcher Rate
The break-even switcher rate is the switcher rate that balances the program’s costs and savings to make the program fiscally neutral. That is:
Break-even switcher rate = [program cost per student] / [per-student savings from switchers]
From the state’s point of view, this rate will be the average marginal per-student cost of the ESA divided by the average savings to the state for each student who switches from the public school system to participate in the choice program.
Here’s a simple example. Consider a choice program that awards ESAs worth $8,000 for all eligible students. If the average marginal cost per student to the state to fund the public school system is $10,000, then the break-even switcher rate is 80% (= $8,000/$10,000). Thus, if more than 80% of ESA students are switchers, the program will generate net fiscal savings for state taxpayers.
The fiscal effect of choice programs is a matter of design. It’s possible to design a program with cost neutrality in mind. Consider that the state’s average marginal cost to fund K–12 students in New York State’s public school system is about $7,200. A choice program that provides ESAs worth 90% of this cost, or $6,500, implies a break-even switcher rate of 90%. Therefore, if more than 90% of students participating in the program are switchers, the program will generate net savings for the state. The present analysis considers models with and without state savings in mind.
Take-Up Rates
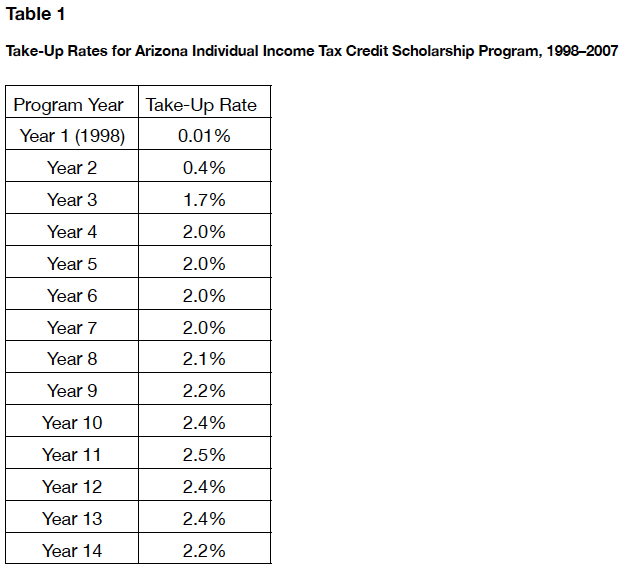
The last important assumption for the analysis involves the take-up rate (the percentage of eligible students who participate in the program). [32] The analysis uses 1% and 10% take-up rates. The lower-end assumption resembles the experience of the Arizona Individual Income Tax Credit Scholarship Program, the nation’s first tax-credit scholarship program (Table 1). Launched in 1998, this program is open to all K–12 students, including students not enrolled in public schools. Take-up rates observed in the initial year of other choice programs are typically around 1%. [33]
Potential Fiscal Effects of Education Savings Accounts in New York
ESA Models Under Consideration
This report presents two models. First, it considers an ESA program designed to be cost-neutral or cost-saving for the state. Anticipating a program where at least 90% of students would be switchers, it sets the ESA amount equal to 90% of the state’s average marginal cost, or $6,500 (= 0.90 x $7,200). [34] Those who desire greater short-run savings for the state may prefer this model.
The analysis also considers an ESA amount equal to 100% of the statewide average amount of total per-pupil state aid distributed to districts in 2018–19.35 Under this model, eligible students would receive an ESA worth $9,900. Those who wish to maximize educational opportunity and create stronger incentives for educational innovation and pluralism may prefer this model.
Estimates for both models are reported for different switcher rates of 100%, 90%, 80%, and 70%, plus 1% and 10% take-up rates.
Under these models, the ESA cost is just 24%–36% of the per-student cost to educate the same student in the public school system (Figure 3).

Fiscal impacts overall
Table 2 presents a summary of results for fiscal effects on the state budget, public school districts, and all taxpayers (combined state and local impact). The top panel considers an ESA worth $6,500 and 1% take-up rate. Based on the experiences of choice programs in other states, this 1% take-up rate is a more likely scenario than the higher rate (10%), which is also considered.
Because the per-student cost of the ESA program is set at 90% of the state’s average marginal perstudent cost to fund students’ education in the public school system, the break-even switcher rate for the state is 90%. Therefore, if more than 90% of ESA students are switchers, the state would incur net savings worth up to $19 million (or $700 per ESA). If less than 90% of ESA students are switchers, then the state would incur net fiscal costs worth up to $39 million (or $1,400 per ESA). Local districts would experience between $197 million and $282 million ($7,400–$10,500 per ESA student) in estimated net variable savings. Combining these results implies that New York taxpayers overall would experience between $159 million and $301 million in estimated short-run net fiscal benefits (or $5,900–$11,200 per ESA student).
Table 2
Summary of Fiscal Effects on State Budget, District, and Taxpayers for ESA Programs Under Different ESA Amounts, Take-Up Rates, and Switcher Rates

Notes: Parentheses ( ) denote a negative value. Components of state aid based on enrollment used.
The calculation for ESA uses the following components of state aid based on enrollment: foundation aid, public high-cost excess cost aid, private excess-cost aid, textbook aid, computer software aid, library materials aid, and computer hardware and-technology aid.
The lower panel considers an ESA set to the statewide average of total state aid per student, or $9,900. Under this model and assuming a 1% take-up rate, the state’s estimated net fiscal impact ranges from $73 million to $131 million ($2,700–$4,900 per ESA) in net costs, depending on the switcher rate. These costs represent 0.2%–0.4% of total state funding for the state’s K–12 public school system. The fiscal effects on local districts are independent from the ESA amount. Therefore, estimates are the same as those for the other ESA model: between $197 million and $282 million ($7,400–$10,500 per ESA student) in net variable savings. Combining these results implies that New York taxpayers overall would experience between $94 million and $236 million in short-run net fiscal benefits (or $3,500–$8,800 per ESA student). The distribution of these fiscal effects will vary significantly across school districts.
Fiscal Impacts by District
The net fiscal impact on individual school districts when students leave for any reason is determined by the relationship between its reduction in revenue and its short-run variable costs. Thus, the net fiscal impact is driven by already-existing cost structures at the district level and the state’s school funding system.
- If a reduction in revenue exceeds variable costs, the district incurs a negative fiscal impact. That is, the district cannot completely cover its reduction in revenue solely by reducing variable costs. The district benefits fiscally when a revenue reduction is less than variable costs, and the district can end up with more resources per student if it reduces costs exactly commensurate with its revenue reduction.
Our analysis includes 669 school districts and excludes charter schools and nontraditional school districts. All but 15 school districts in New York would experience net fiscal benefits if students leave to participate in an ESA program (or if students choose to leave for any other reason). For the vast majority of these districts, estimated short-run variable costs per student exceed the estimated reduction in state aid per student. Thus, districts can reduce their costs by an amount that matches or exceeds its reduction in state aid payments when enrollment decreases. Depending on how the district decides to reduce costs, students who remain in district schools may end up with more resources per student.
For the remaining 15 school districts, estimated variable costs per student are less than state aid per student. These districts may incur a negative net fiscal impact in the short run. In the long run, districts can eventually fully adjust for reduction in revenue for a given decrease in enrollment.
Table 3.a
District Enrollment, Revenue, Estimated Variable Cost, and Estimated Marginal Fiscal Effect of Students Leaving District Schools
Table 3.b
Enrollment, Revenue, Estimated Variable Cost, and Estimated Marginal Fiscal Effect of Students Leaving District Schools for New York’s “Big Five” School Districts

Table 3 reports information about enrollment, expenditures, total state aid per pupil, average reduction in state aid when students leave, estimates for short-run variable costs, and the estimated short-run NFE on districts when students leave for any reason for the state’s “Big Five” school districts. [36] Let’s consider New York City. Total cost per student in NYC public schools is almost $30,000. NYC public schools receive an average of $10,000 in state aid. When a student leaves, the district’s state aid is reduced by a lesser amount of $7,700, on average. NYC public schools have, on average, about $19,300 in estimated variable costs that can be reduced to match its revenue reduction. They can reduce costs by the full variable amount, or they can reduce costs to exactly match the state aid reduction. In the latter case, students remaining in public schools will end up with more resources on a per-student basis.
Table 4 displays the estimated fiscal effects for the “Big Five” school districts, assuming a 1% take-up rate and 90% switcher rate. [37] Note that estimates are independent of the ESA amount.
For a 1% take-up rate and 90% switcher rate, the short-run net fiscal impact on NYC public schools is an estimated $112 million. Under this scenario, almost 9,700 students would leave the district via the program, subsequently reducing state aid by $75 million. The district, however, would be able to save as much as $187 million in variable cost burden relief. Distributing these effects across students remaining in NYC district schools would amount to $130 in net fiscal benefits for each NYC district student.
Syracuse and Yonkers would also incur short-run fiscal benefits worth $136,000 and $1.8 million, respectively (or $7 and $78 for each student who remains in the district). Buffalo and Rochester would incur net fiscal costs in the short run, estimated at $540,000 and $208,000, respectively (or $18 and $9 for each student who remains in the district).
Table 4.a
Fiscal effects of ESA program on school district (1% take-up rate, 90% switcher rate)
Table 4.b
Fiscal Effects of ESA Program for New York’s “Big Five” School Districts (1% Take-Up Rate, 90% Switcher Rate)

A common critique of educational choice programs is that they siphon resources from public schools. But while schools may receive less funding, they also have fewer students to educate. Deciding how to reallocate resources when enrollment declines is, of course, challenging. And because not all school funding is allocated according to the number of students, the relative drop in funding is often less than the decline in enrollment. Indeed, in both scenarios considered (1% and 10% take-up rates), district budgets would remain almost fully intact. For a 1% decrease in enrollment, budgets would be reduced by 0.2% on average, implying that 99.8% of their total budgets would remain intact. If 10% of district students choose to participate in an ESA program, budgets would be reduced by 2.3% on average, implying that 97.7% of districts’ budgets would remain intact. Table 5 presents the expected reduction in total budget for the big five school districts. [38]
In the context of educational choice, public schools have managed these realities well. Of 27 rigorous studies that examined this question, 25 found that after a choice program was introduced, students who remained in affected public schools experienced positive gains on test scores. [39] Enrollment fluctuation is a reality that occurs with regularity and one that schools of all kinds have had to deal with over time.
Table 5.a
Estimated Effects of ESA Program on State Aid and Percentage of District Budget That Remains Intact If 1% and 10% of District Students Participate in ESA Program
Table 5.b
Estimated Effects of ESA Program on State Aid and Percentage of District Budget for New York’s “Big Five” School Districts That Remains Intact If 1% and 10% of District Students Participate in ESA Program

Source: Author’s estimates, NYSDOE, NCES, and U.S. DOE
Note: Estimates assume 90% switcher rate.
Conclusion
This brief discusses the potential fiscal effects of an ESA program in New York. The fiscal effects will depend on program design, which will reflect desired goals and values for the state’s K–12 education system. A program with broader eligibility and higher ESA value will promote greater educational opportunity and invite more innovation, while a program with limited eligibility and lower ESA value will likely generate greater short-run savings for the state.
Furthermore, because an ESA would generate fiscal benefits for taxpayers, students who remain in public schools may end up with more resources on a per-pupil basis.
For some, K–12 education is a zero-sum game, where supporting educational choice and opportunity means opposing and harming the public school system. The large body of research on private school choice programs, however, suggests otherwise. [40] These programs not only benefit students participating in them, but they also accrue benefits for families, communities, and even public schools themselves. The Empire State can expand educational opportunities for its families without adverse effects to its bottom line.
Appendix Table A. Prior Public School Enrollment Requirements for Private K–12 Educational Choice Programs
See Appendix in PDF
Endnotes
See Endnotes in PDF
Acknowledgments
I wish to thank Lew Andrews and Steve Looney at E3 for supporting this work and offering helpful remarks. Ray Domanico and Brandon Fuller provided valuable insights and commentary that improved earlier drafts of this report. Sean Giambattista provided valuable assistance with understanding the state’s school funding formula and locating data
Are you interested in supporting the Manhattan Institute’s public-interest research and journalism? As a 501(c)(3) nonprofit, donations in support of MI and its scholars’ work are fully tax-deductible as provided by law (EIN #13-2912529).