Connecticut City Pensions: The Affordability Gap

An Analysis of Bridgeport, New Haven, Hartford, Stamford, and Waterbury
Connecticut state government’s pension struggles are well understood: deep levels of underfunding have led to credit-rating downgrades, tax increases, recurring budget deficits, and an inability to fund essential services. What has been overlooked, though, is the challenge that the state’s five largest cities by population—Bridgeport, New Haven, Hartford, Stamford, and Waterbury—face in paying for their own retirement benefit promises.
- All five of these cities have promised hundreds of millions of dollars in benefits, a promise that is backed, ultimately, by their tax base. With the exception of Stamford, however, they all have weak economies and elevated rates of poverty.
- While the state’s record of pension mismanagement is well documented, cities have been guilty of mismanagement as well. However, for the state’s five biggest cities, the question of affordability is more important than mismanagement.
- Despite rate increases, property tax revenues have not been keeping up with pension costs in New Haven, Hartford, and Stamford. Hartford’s property tax revenues, for example, grew by $2.7 million from FY08 to FY17 in real terms, while its pension costs grew by $16.7 million. Though annual costs for retiree health care have not risen as dramatically, they are still high, totaling $132 million for all five cities combined. This is a questionable expenditure, considering that the private sector has largely phased out health-care benefits for retired workers.
- The case for dramatic retirement benefit reform—meaning phasing out retiree health care and transitioning workers from a defined-benefit to a defined-contribution plan—may be more urgent for Connecticut’s biggest cities than for the state.
Introduction
Connecticut state government’s pension struggles are well understood: deep levels of underfunding have led to credit-rating downgrades, tax increases, recurring budget deficits, and an inability to fund essential services. What has been overlooked, though, is that Connecticut cities face pension struggles of their own. This report will survey the retirement benefit programs of the state’s five largest cities by population: Bridgeport, New Haven, Hartford, Stamford, and Waterbury.
Hartford, New Haven, Stamford, and Waterbury operate their own independent pension systems. Bridgeport participates in a statewide system (but the city is responsible for meeting its own pension obligations). All of these cities also offer retiree health-benefit programs that are run locally. All five cities have promised hundreds of millions of dollars in benefits, a promise that is backed, ultimately, by their tax base. The health of that tax base is essential to understanding the health of the cities’ retirement benefits.
Connecticut is often described as a “blue state,” a term that, in addition to its political connotations, indicates high levels of taxation and government spending. Many in Connecticut embrace this model, in contrast to what public officials have described as that of “low public investment states” elsewhere. But rising retirement benefit costs are substantially the costs of the past: government spending is rising, but levels of “investment” are not. Thus, escalating legacy costs pose a direct challenge to Connecticut’s “high services” model—for cities as well as for state government.
Connecticut Public Retirement Benefits: An Overview
When Standard & Poor’s downgraded Connecticut’s credit rating this past April from A+ to A, it cited the state’s “high unfunded pension liabilities” as a major reason.[1] In its most recent nationwide survey of state governments’ pension systems, the Pew Center on the States ranked Connecticut fourth-to-last in funding. Only Illinois, New Jersey, and Kentucky had lower funded ratios.[2] Connecticut devotes a greater share of its revenues to servicing its debt and retirement benefit liabilities than all but two states.[3] Since the Great Recession, Connecticut has raised personal income taxes three times (2009, 2011, 2015)[4] but continues to face deficits. Slow rates of GDP and income growth have forced a debate over the state’s economic competitiveness,[5] but its massive liability totals will limit Connecticut officials’ ability to bring down taxes.
Amid these concerns about the state, the pension situation at the local level has largely escaped notice. Public pensions in Connecticut are unusually decentralized. A total of 212 public pension plans are in Connecticut—the sixth-highest total of any U.S. state[6]—and 206 of them are local plans. Of the state’s five largest cities—Bridgeport, Hartford, New Haven, Stamford, and Waterbury—all except Bridgeport operate their own independent systems. Bridgeport active employees participate in the statewide Municipal Employees Retirement System.[7]
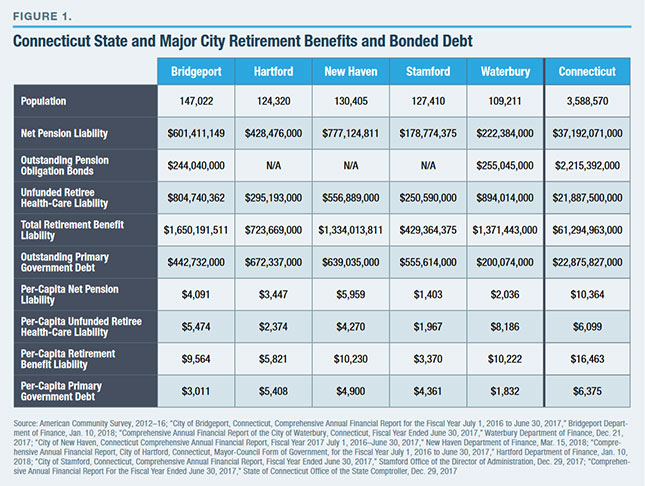
Connecticut’s five largest cities owe hundreds of millions of dollars in retirement benefit obligations (Figure 1). Retirement benefits, in each case, comprise pensions and health care. The latter is often referred to in government financial statements as OPEB (other post-employment benefits). Benefit levels, eligibility, and worker contributions vary between cities and, to some extent, between employee cohorts within the same municipal workforce.[8] Generally speaking, however, retiree health care entails providing full coverage between the time a worker becomes eligible for a defined-benefit pension and retires, and when he becomes eligible for Medicare (public employees, particularly police and firefighters, often retire before age 65) and then supplemental coverage (including payment of Medicare Part B premiums) for some out-of-pocket costs not covered by Medicare.
The retirement benefit liabilities in Figure 1 are expressed in absolute terms and also in per-capita terms, so that cities can be compared with one another and with state government, and against cities’ bonded debt obligations.
On a per-capita basis, each city owes thousands of dollars in retirement benefit liabilities, and the total exceeds the total owed for bonded debt. (Amounts for pension obligation bonds—debt issued to pay off pension liabilities—are included under Total Retirement Benefit Liability.) Retirement liability costs are ultimately the responsibility of city governments, even when, in the case of Bridgeport, they are managed at the state level. The liabilities reflect benefit promises made to city workers for which assets are currently inadequate. Thus, each of New Haven’s citizens will, in effect, have to come up with $10,230 to ensure that that city’s retired workers receive the pension and health-care benefits they were promised throughout their retirement years.
The state government has the largest per-capita total. One reason: pensions for Connecticut public school teachers, who constitute the largest government employee cohort in the state (and the nation, for that matter), are funded by state government. During the 2017 budget debate, when lawmakers had to close a $5.1 billion two-year deficit, Governor Dannel Malloy proposed shifting one-third of the costs of teacher pensions onto localities. However, this proposal was blocked by the legislature, and teacher pension funding remains a state responsibility.
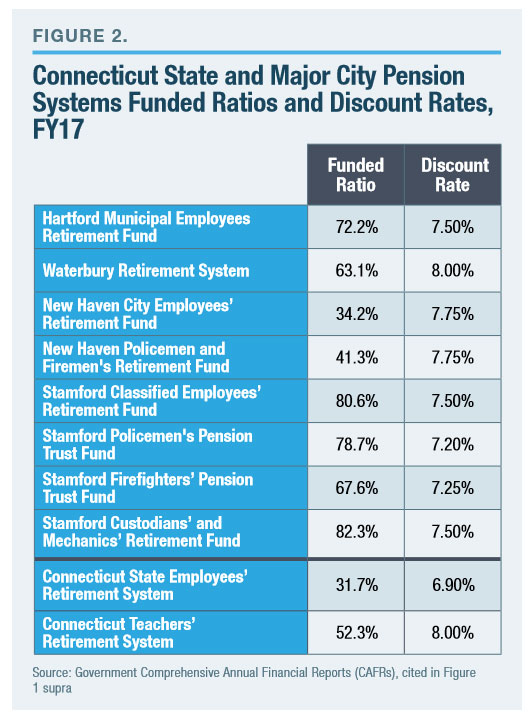 Figure 1 expresses the “unfunded” portion of the state’s liability—the gap between how much it has on hand versus how much it has promised—in absolute terms. Figure 2 expresses the unfunded liability of major city systems in relative terms, as a ratio of assets to liabilities. Four out of the eight systems have funding levels below 70%.
The “discount rate” column in Figure 2 shows the assumed investment rate of return on assets that each system uses in evaluating the size of its liability in present value terms. The higher a discount rate, the more optimistic a system is about its return on investment. Overly aggressive discount rates—8% and higher—have come in for criticism for overstating the financial health of pension plans and allowing government sponsors to contribute too little (the more a system expects to earn through investment return, the less it has to ask taxpayers each year to contribute). In response to this criticism, many systems have reduced their rates in recent years. For public pension systems nationwide in 2016, the median discount rate was 7.5%, down from 8% in 2010.[9]
Figure 2 also shows that several city systems have higher funded ratios than Connecticut state government. These include the system of Hartford, which was last year placed under state oversight as part of a package of financial assistance to save that city from insolvency.[10]
A government’s retirement benefit program depends substantially on the strength of that government’s tax base, just as a corporate pension plan is backed, ultimately, by the health of its sponsor’s business. Connecticut has faced economic headwinds of late; but by most conventional measures, it still has a strong tax base. At $71,755, the state’s median household income ranks fifth among all American states; and at 10.4%, its poverty rate is fourth-lowest.[11] It boasts a higher concentration of millionaires (measured by the proportion of federal income tax filings reporting income of $1 million or more) than any other northeastern state.[12] It is host to 17 Fortune 500 companies’ headquarters,[13] and its hedge-fund industry is second only to New York’s, measured by assets under management[14]. The state, in the phrase of Endicott College’s Joshua McCabe, has a high “fiscal capacity.”[15] It has more resources to tap, in an economic sense, to fund the cost of government than most other states.
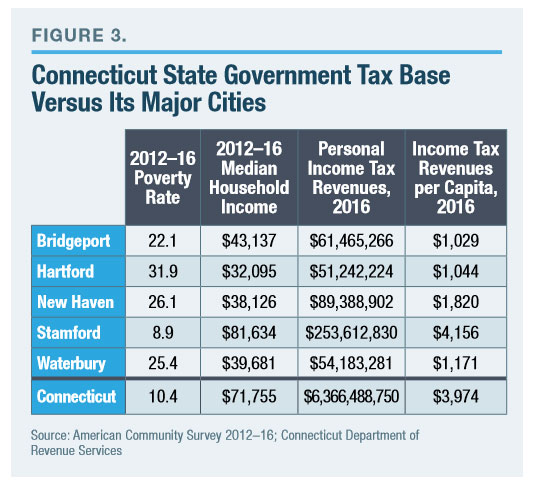 Connecticut’s major cities, however, have low fiscal capacities (Figure 3). Compared with the statewide average, for example, all but Stamford generate low levels of income tax revenue and have elevated poverty rates. Hartford’s per-capita retirement benefit burden may be one-third that of the state’s (Figure 1), but Hartford has a poverty rate roughly three times that of the state as a whole (Figure 3). Among the roughly 300 U.S. localities with a population of 100,000 or more, only 14 have a poverty rate above 30%, and Hartford is one of them[16]. Clearly, it’s one of the poorest major cities in the nation. New Haven and Waterbury, whose poverty rates among cities with a population of 100,000 or more are 36th and 41st, respectively, are not far behind.
State and Local Government Pension Mismanagement
Connecticut state government’s pension struggles reflect a combination of poor management and lack of will. As several studies have detailed,[17] state government declined to make adequate budgetary appropriations into its pension system over the course of decades. Informed observers knew what would eventually happen. In his audit of state finances for FY 1992, State Comptroller William E. Curry, Jr. warned that a recent decision to forgo more than $200 million in pension contributions out of the “normal funding requirement” would, “like deficit financing … burden future generations with taxes for services they will not receive.”[18] A 1993 report on the status of the State Employees Retirement System (SERS) plan by Deloitte & Touche noted that its funded ratio was the third-lowest among all state pension systems and that “Connecticut SERS is being funded using less conservative economic assumptions than are being used by most other state employee retirement systems.”[19] When state officials had access to more revenues, such as after the introduction of the “gross income tax” in the early 1990s, they opted to support other services and programs with funds that could have gone to fully fund the actuarially required contribution.[20] Now liabilities have swelled dramatically, and state officials have little choice but to fund pensions instead of other services and programs. Rising pension costs, according to the Connecticut Commission on Fiscal Stability and Economic Growth, a blue-ribbon state task force, have “crowded out” funds available for infrastructure, local aid, and the social safety net.[21]
In February 2017, state officials agreed to shift $14–$21 billion in costs for SERS onto the next generation of taxpayers (2033–47).[22] They did this out of a fear that without some sort of “refinancing,” annual costs could spike to $6 billion within the next 15 years (annual costs currently stand at about $2 billion). Governor Malloy and the Connecticut Commission on Fiscal Stability and Economic Growth have called for taking a similar approach to the state Teachers’ Retirement System (TRS).[23]
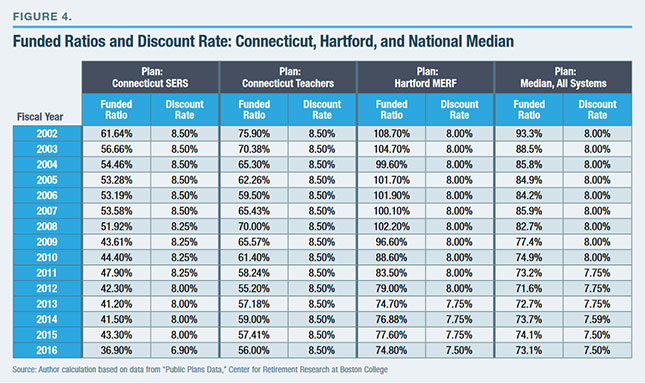
Are Connecticut cities’ pension management records superior to those of state government? The higher funded ratios noted in Figure 2 indicate that, in some cases, this is indeed the case. A pension-funding requirement placed in Hartford’s city charter in the 1940s has imposed fiscal discipline on the state capital.[24] The city’s funded ratio is almost exactly the same as the median for systems nationwide, whereas SERS and TRS ratios are well below the national median. As recently as 2008, Hartford’s Municipal Employees’ Retirement Fund (MERF) was overfunded (Figure 4). The state plans have trailed the national average since at least the 1980s.[25]
Nevertheless, measuring a city’s pension management record against that of the state government’s may not be the most useful standard. At 8%, Hartford’s discount rate was long the industry standard and lower than the state’s plans, which have been higher than national averages since at least 1990.[26] Even so, Hartford’s current funded ratio is not 100% (Figure 2), despite a respectable record of making its pension contributions. This indicates that it, like the state, has not exhibited strong discipline in pension management. Using a lower discount rate would have required Hartford to make larger contributions, but funding levels at present would have been more robust. A more concrete example of pension mismanagement recently occurred during its 2016 budget cycle, when Hartford transferred a city park to its pension system, to save on its annual contribution.[27]
In 2009, Waterbury, whose retirement system was funded at a rate below 10%, issued $315 million in pension obligation bonds.[28] Pension obligations are a financial instrument that is viewed with wariness by the Government Finance Officers Association, among others.[29] By issuing bonded debt and then putting the proceeds into its retirement system, the government issuer of pension obligation bonds hopes that the rate of return on investment will exceed the interest rate that it must pay on the bonds. That does not always happen.[30] Bridgeport has twice issued pension obligation bonds[31] since 2000. The city also recently sought and received special permission to reduce its pension contributions,[32] over the objections of the state treasurer, who warned that such a maneuver “could put the integrity of the plan at risk.”[33] New Haven, whose systems have the lowest funded ratios among all five cities (Figure 2), recently considered issuing pension obligation bonds.[34]
There may be a relation between fiscal capacity and mismanagement. True, affluent jurisdictions can be guilty of fiscal mismanagement. But when a city has a weak tax base, it is going to be tempted to engage in more short-term-oriented fiscal practices. Funding a pension bill that won’t come due in full for decades will come to seem like an unaffordable luxury when revenues to support current municipal service levels are inadequate. Some of the fiscal maneuvers taken by Connecticut cities may have been justifiable as the more preferable between two highly unattractive options. But they do raise pertinent questions about the basic affordability of retirement benefit commitments.
The Emergence of a High Tax / Low Services Government Model
To raise revenues, the major tool that cities in the Nutmeg State can use is the property tax: there is no general local sales or income tax in Connecticut.[35] Connecticut local governments rely on the property tax more than in any other state (Figure 5). (In the aggregate, local governments nationwide rely on property taxes for only 46.6% of their general own-source revenues.)
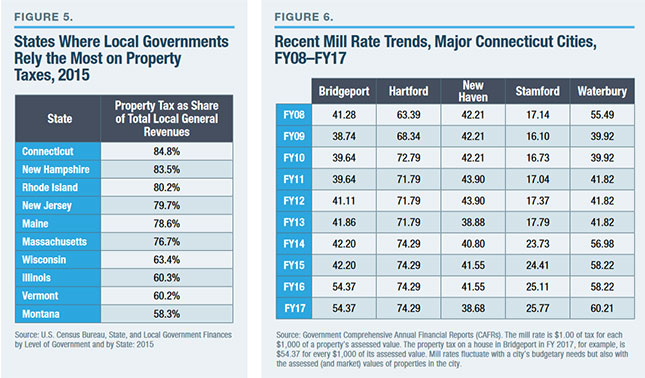
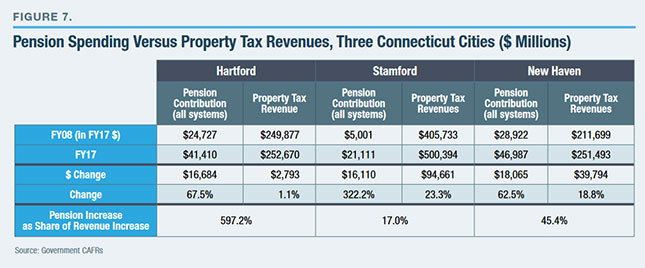
Figure 6 shows that cities have been making active use of their main revenue lever: property tax rates have been rising, in recent years, in all the cities, with the exception of New Haven (where tax rates have remained around a narrow range). Major Connecticut cities’ revenue needs would be far less pronounced if their liabilities were not so onerous. Waterbury estimates that it is “paying the equivalent of 23.57 mills” for pension and retiree health-benefit liabilities that were previously incurred, and its mill rate could be over 20 points lower if not for those costs.[36]
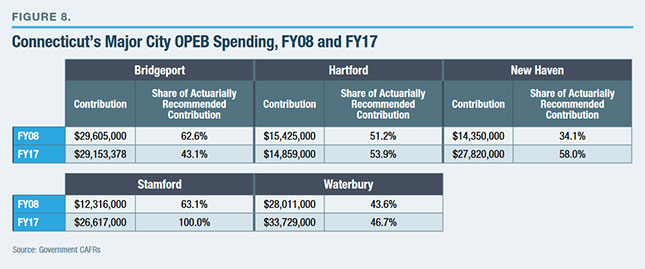
Despite tax increases, property tax revenues have not been keeping up with pension costs in the case of New Haven, Hartford, and Stamford (Figure 7).[37] On an inflation-adjusted basis, Hartford’s property tax revenues grew by a modest amount—$2.7 million—from FY08 to FY17. But pension costs grew by $16.7 million in real terms, or about 600% of the increase in property tax revenue. The disparity is not as stark for Stamford and New Haven. Still, because pension costs grew more rapidly than property tax revenues, pension costs reduced the amount of new revenue that New Haven and Stamford could devote toward other purposes by 45.5% and 17%, respectively.
In FY08, contributions for Hartford’s main MERF system represented 12.4% of payroll. Now they are 26.1%.[38] The contribution rate to Stamford’s police plan, measured as a share of payroll, has increased by five times (7.4% to 35.4%).[39] The city of New Haven, for its public safety plan members, is now contributing 45 cents for every dollar of salary.[40] These increases have not occurred because benefits have become more generous; they have not. They have occurred because these governments have had to increase their contributions to pay off unfunded liability. In short, whether benchmarked against payroll or property tax revenues, pension costs in major Connecticut cities have risen dramatically over the last decade.
Rising pension payments have contributed especially to Hartford’s fiscal distress. Fearing that Connecticut’s capital city would face insolvency, and potentially bankruptcy, state government agreed to provide financial assistance (a “bailout”) in exchange for oversight.[41] State officials established the Municipal Accountability Review Board (MARB), from which, last December, Hartford formally sought designation as a Tier III municipality (Tier IV being the most deeply distressed).[42] MARB’s oversight regime requires Hartford to submit its annual budget for approval to the state agency as well as provide regular reporting on current cash flow and long-term financial outlook. The city is currently projecting balanced budgets over the next five years.[43]
An annual pension contribution has two main components: the “normal” cost—payment to cover benefits accrued in the current year (equivalent to a private employer’s 401(k) contribution); and the payment to cover benefits earned in past years but not adequately funded. Of the $44.4 million that Hartford’s actuary claimed that it needed to contribute in FY18, roughly two-thirds, or $29.9 million, was required to pay for benefits earned in past years (in other words, to amortize the system’s unfunded liability).[44] The vast majority of Connecticut state government’s bill is also devoted toward its unfunded liability.[45] But the state is not on the verge of true insolvency.
When combined with its annual OPEB bill—about $14 million last year—Hartford’s spending on the promises of the past total about the cost of the $40 million state-financed “bailout” that it claimed it needed to avoid bankruptcy last year.[46] Without a retirement benefit burden, Hartford would still likely be a distressed city and certainly a poor one, but it might not be a city on the verge of insolvency.
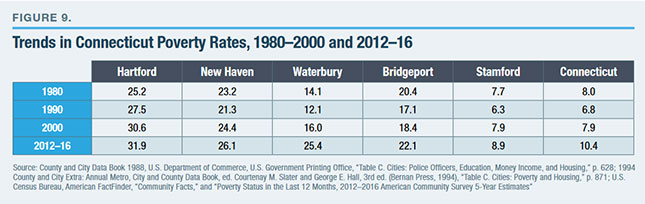
Figure 8 looks at the change in cities’ OPEB costs over recent years. In many cases, they have not risen dramatically. That is because most of these cities do not “pre-fund” their retiree health-care programs as they do their pension plans. Annual pension contributions go into a trust that, when combined with contributions from workers and decades of investment return, is intended to be sufficient to pay off workers’ benefits throughout their retirement years. OPEB, though, is generally funded on a pay-as-you-go basis. Cities budget only for the cost of those benefits received by retirees in a given year. The cost of health care does not change as much on an annual basis as pension costs, which are determined substantially by the volatility of financial markets. Thus, there is less of a “crowd out” effect related to OPEB costs than pension costs. Stamford, which recently enacted a plan to fully pre-fund its OPEB obligation, is the exception. Accordingly, its contributions have increased much more rapidly since FY08 than the other four cities.
But if crowd-out is less of a concern with OPEB, the larger question is whether it is a justifiable expense in the first place. Collectively, Connecticut’s five largest cities spent $132 million on retiree health care in FY17. Unlike cash retirement benefits and health insurance for active workers, retiree health care is not a standard benefit offered by private-sector employers. Less than 10% of private firms in Connecticut that provide health insurance to active workers also offer it to retirees.[47] It is therefore questionable whether Connecticut cities truly need to take on this obligation that is not only expensive but also tempts them into transferring compensation costs for services provided in the present onto future taxpayers. Though Stamford is, in many respects, doing the right thing in trying to pre-fund its OPEB obligations, there is an argument that the wiser path would be to try to phase out of the benefit as promptly as possible.[48] Pre-funding is, in a way, redoubling a government’s commitment to a gratuitous expense. Gratuitous public expenditures should be scrutinized especially carefully in the case of poor cities.
Retirement Benefits: Fiscal Capacity, Management, and Affordability
This year’s election for state office is competitive, and some gubernatorial candidates are running on platforms of bold action on pension reform. But, in practice, the reform of retirement benefits is a complex issue: What priority, if any, should be placed on changes to current workers’ plans versus those of future workers? Should government pursue OPEB reform as well as pensions?
The preceding analysis suggests that retirement benefit reform at the local level should not be neglected and should possibly be prioritized over state-level reforms. While Connecticut’s record of mismanagement should raise doubts about whether it can ever be trusted to responsibly manage a defined-benefit pension program, Connecticut’s major cities’ economic fundamentals should raise doubts about whether they can afford a defined-benefit system even if they can responsibly manage it.
The state government’s fiscal capacity—its ability to raise sufficient revenues to support the cost of government—has faced constraints of late. Connecticut’s economy has contracted in three of the last four years and, in 2017, ranked 49th among all states, according to the Bureau of Economic Analysis. High-profile corporate relocations have created political crises for state officials;[50] and IRS data show that each year, billions of dollars in income leave for other states, some of which have lower taxes and/or no income tax.[51] Concerns over the health of the state’s economy have weakened political support for tax increases. A further check on the state’s revenue-raising abilities may come from the recently enacted federal tax reform, one of the most notable provisions of which was a limit on how much income tax filers can claim through the state and local tax deduction (SALT). Connecticut taxpayers have been one of the largest beneficiaries of SALT. In 2015, the most recent year for which IRS data are available, the 726,000 filers who claimed the “taxes paid” deduction claimed over $19,000, on average. The recently enacted federal law caps that amount at $10,000.
Though some have claimed that the new cap on SALT will also complicate Connecticut cities’ fiscal policies,[52] their revenue problems are more straightforward. As the state’s Office of Legislative Research notes, SALT usage declines with income.[53] Given their low income levels (Figure 3), relatively few households in Hartford, New Haven, Bridgeport, and Waterbury itemize; and with the new tax law’s expansion of the standard deduction, still fewer will itemize in coming years. The new tax law may limit how much state government can redistribute from wealthy suburban taxpayers to the general treasuries of bigger and poorer Connecticut cities. But poor cities’ revenue-raising capacity has always been constrained and will remain so.
All of Connecticut’s five largest cities, in their annual financial statements, express optimism about their economic development prospects.[54] But their recent histories provide little evidence that an economic revival is impending for Bridgeport, Hartford, New Haven, and Waterbury. (Stamford has never truly known decline.)
All five of Connecticut’s largest cities have experienced increased poverty rates over recent decades (Figure 9). Technically, the statewide poverty rate has increased more than that of all its major cities except for Waterbury, but that is partly because those cities were beginning from a higher base: a poverty rate of over 20% in 1980 in the cases of Bridgeport, Hartford, and New Haven. (The nationwide poverty rate in 2012–16 was 15.1%.) Hartford’s poverty rate was roughly three times that of Connecticut’s in 1980, and that same proportion remains today.
Some local officials have expressed interest in developing an urban revitalization strategy centered on attracting more young, educated, millennials. But that cohort is expected to decline over the near-term. Between now and the early 2030s, the number of graduating high school seniors in Connecticut will drop by 7,815, or 19.2%; and by 7.9%, or 48,153, throughout the Northeast.[55] That is to say, in coming years, Hartford, New Haven, and Connecticut’s other major cities face a zero-sum competition for millennials with Boston and New York. As for families, while most of these cities have managed to retain some of their single-family building stock,[56] continued weakness in Connecticut’s urban school systems, particularly relative to those of suburbs and towns, will make attracting and retaining middle-class families a challenge.
The ability of some of Connecticut’s biggest cities to raise revenue has been hampered by the high proportion of tax-exempt property. About half of Hartford’s tax base is owned by nonprofits and governments. This is due partly to policy decisions such as a significant investment in public school buildings over the last 15 years but also to an unusual valuation system. Residential properties in Hartford—a large proportion of its taxable tax base—are valued at only 33.82% of market value for tax purposes.[57] (The standard assessment ratio for all properties for Connecticut local governments is 70% of market value.)[58] In a larger sense, though, the low proportion of taxable property in Hartford is a function of the weakness of the local economy.
Fiscal capacity is not simply a function of a tax policy.[59] While Connecticut’s municipal finance system is unusually reliant on property taxes (Figure 5), it is doubtful that more local fiscal autonomy or increased “revenue diversification” would help cities much. A local income tax[60] could easily harm Connecticut cities’ competitiveness. Boston has no local income tax, and Massachusetts’s state rate is about 2 percentage points higher than Connecticut’s top marginal rate. Indeed, the larger state context must be kept in mind. Theoretically, lower state taxes could free up more fiscal capacity for city governments. However, because of Connecticut’s massive liabilities, state sales and income taxes are unlikely to significantly decline anytime soon.
Conclusion
The fundamental question this paper raises is: How wise is it for Connecticut cities with weak tax bases—low fiscal capacity—to operate defined-benefit retirement programs? The prospect of transitioning state workers to a defined-contribution retirement benefit plan has been raised frequently in debates over Connecticut’s pension crisis. Given that the state government’s record of retirement benefit mismanagement stretches back across the generations and continues into the present, and that both parties share the blame, we can reasonably doubt whether the state should ever be trusted to manage a long-term defined-benefit program.
However, the challenge for Connecticut’s major cities has less to do with mismanagement than it does with their ability to pay. Not even prudent management and a sincere will to fund pensions adequately can overcome inadequate fiscal capacity. It may, therefore, be more urgent to consider a shift to defined contribution for city workers in Connecticut than for state workers.
Endnotes
- “S&P: Connecticut GO Debt Downgraded to 'A' From 'A+' on the State's Increased Debt Ratios; Outlook Stable,” Standard & Poor’s, Apr. 13, 2018; “Rating Action: Moody's Downgrades to A1 Connecticut GO Bonds; Outlook Stable,” Moody’s Investors Service, May 15, 2017; “Weak Economy, High Fixed Costs Test Connecticut's Fiscal Management,” Moody’s Investors Service, Apr. 5, 2017; “State of Connecticut General Obligation Bonds (2018 Series C) & General Obligation Refunding Bonds (2018 Series D),” Kroll Bond Rating Agency, May 29, 2018.
- “The State Pension Funding Gap: 2016,” Pew Charitable Trusts, Apr. 12, 2018.
- Michael Cembalest, “The ARC and the Covenants, 2.0: An Update on the Long-Term Credit Risk of US States,” JPMorgan Chase, May 29, 2016.
- “FY 2018–FY 2019 Biennium Economic Report of the Governor,” Connecticut Office of Policy and Management, p. 97.
- “Connecticut Commission on Fiscal Stability and Economic Growth Final Report,” Connecticut Commission on Fiscal Stability and Economic Growth, March 2018, pp. 15, 21, 72.
- Author calculation based on U.S. Census Bureau, 2016 Annual Survey of Public Pensions: State & Local Tables. By population, Connecticut is the 29th-largest state in America.
- Bridgeport is also still responsible for maintaining four small “closed” systems (Public Safety Plan A Investment and Pension Trust, Police Retirement Plan B, Firefighters’ Retirement Plan B, and Janitors’ and Engineers’ Retirement Plan). No active employees have been enrolled in any of these plans since the early 1980s.
- “City of Hartford Supplemental Material,” Municipal Accountability Review Board Meeting, Feb. 8, 2018, pp. 20–21; “City of Bridgeport, Connecticut, Comprehensive Annual Financial Report for the Fiscal Year July 1, 2016 to June 30, 2017,” Bridgeport Department of Finance, Jan. 10, 2018, pp. 73–75; “Comprehensive Annual Financial Report of the City of Waterbury, Connecticut, Fiscal Year Ended June 30, 2017,” Waterbury Department of Finance, Dec. 21, 2017, pp. xvi–xvii, 56–57; “City of New Haven, Connecticut Comprehensive Annual Financial Report, Fiscal Year 2017 July 1, 2016–June 30, 2017,” New Haven Department of Finance, Mar. 15, 2018, pp. 74–77; “Comprehensive Annual Financial Report, City of Hartford, Connecticut, Mayor-Council Form of Government, For the Fiscal Year July 1, 2016 to June 30, 2017,” Hartford Department of Finance, Jan. 10, 2018, p. 55; “City of Stamford, Connecticut, Comprehensive Annual Financial Report, Fiscal Year Ended June 30, 2017,” Stamford Office of the Director of Administration, Dec. 29, 2017, p. 76.
- Author calculation based on data from the “Public Plans Data,” Center for Retirement Research at Boston College (2016 is the latest year for which data are available). The Public Plans Data clearinghouse tracks information from 170 state and local plans that collectively account for 95% of public pension assets and members in the U.S. See Figure 4 in the text.
- John Rappa, “Municipal Accountability Review Board Law,” Office of Legislative Research, Report No. 2018-R-0042, Feb. 15, 2018.
- Author calculation based on 2012–16 American Community Survey data.
- John Rappa, “Comparison of Connecticut and Selected States Millionaires Per Capita,” Office of Legislative Research, Report No. 2017-R-0228, Oct. 20, 2017.
- Russell Blair, “These 17 Fortune 500 Companies Are Headquartered in Connecticut,” Hartford Courant, May 23, 2018.
- Michelle Kirby, “Connecticut's Hedge Fund Industry,” Office of Legislative Research, Report No. 2017-R-0021, Jan. 27, 2017.
- Joshua T. McCabe, “Federalism in Blue and Red,” National Affairs, Summer 2017.
- Author calculation based on 2012–16 American Community Survey data.
- J. Scott Moody and Wendy P. Warcholik, “Born Broke: Our Pension Debt Problem,” Yankee Institute for Public Policy, August 2014; Jean-Pierre Aubry and Alicia H. Munnell, “Final Report on Connecticut’s State Employees Retirement System and Teachers’ Retirement System,” Center for Retirement Research at Boston College, November 2015; Keith Phaneuf, “A Legacy of Debate: Connecticut Standing on Its Own Fiscal Cliff,” ctmirror.org, Jan. 30, 2017.
- “State of Connecticut Comprehensive Annual Financial Report for the Fiscal Year Ended June 30, 1992,” Office of the State Comptroller, Dec. 31, 1992, p. 12. Similar warnings were echoed in subsequent years (“State of Connecticut Comprehensive Annual Financial Report for the Fiscal Year Ended June 30, 1993,” Office of the State Comptroller, Jan. 26, 1994, p. 13; “State of Connecticut Comprehensive Annual Financial Report for the Fiscal Year Ended June 30, 1994,” Office of the State Comptroller, Dec. 30, 1994, p. 13).
- “Connecticut State Employees Retirement System Study of Unfunded Past Service Liability,” Deloitte & Touche, Mar. 23, 1993, pp. 8, 20.
- Aubry and Munnell, “Final Report on Connecticut’s State Employees Retirement System and Teachers’ Retirement System,” pp.9-10, 32-33.
- “Connecticut Commission on Fiscal Stability and Economic Growth Final Report,” Connecticut Commission on Fiscal Stability and Economic Growth, March 2018, pp. 15, 21, 72.
- “Gov. Malloy and State Employee Unions Reach Agreement on Pensions That Will Support the Employee Retirement System While Strengthening the State's Financial Obligations,” Office of Governor Dannel P. Malloy, Dec. 9, 2016; “Gov. Malloy & Lt. Gov. Wyman Statements on Legislative Approval of Pension Agreement,” Office of Governor Dannel P. Malloy, Feb. 1, 2017; “Gov. Malloy: Actuarial Analysis Affirms Billions in Taxpayer Dollars Will Be Saved by Adopting Framework Reached with State Employee Unions,” Office of Governor Dannel P. Malloy, May 23, 2017.
- “Gov. Malloy Statement on Reports of Costs Related to the Teachers’ Retirement System,” Office of Gov. Dannel Malloy, Dec. 26, 2017; Keith M. Phaneuf, “Malloy: Time to Stretch Out Spiking Teacher Pension Costs,” ctmirror.org, Dec. 27, 2017; “Connecticut Commission on Fiscal Stability and Economic Growth Final Report,” Connecticut Commission on Fiscal Stability and Economic Growth, March 2018, appendix 2.
- “City of Hartford Financial Overview Municipal Accountability Review Board,” Office of Mayor Luke Bronin, Feb. 8, 2018, p. 25.
- Aubry and Munnell, “Final Report on Connecticut’s State Employees Retirement System and Teachers’ Retirement System,” pp. 7, 30.
- Ibid., pp. 13, 35.
- “City of Hartford, FY2017 Adopted Budget,” pp. 2-1–2-4; “Comprehensive Annual Financial Report City of Hartford Connecticut, Mayor-Council Form of Government for the Fiscal Year July 1, 2014 to June 30, 2015,” Department of Finance, City of Hartford, Jan. 28, 2016, p. 41.
- “City of Waterbury, Connecticut, $313,145,000 Taxable General Obligation Pension Bonds, Series 2009,” Official Statement, Sept. 1, 2009.
- Government Finance Officers Association, “Pension Obligation Bonds,” January 2015.
- Alicia H. Munnell, Jean-Pierre Aubry, and Mark Cafarelli, “An Update on Pension Obligation Bonds,” Center for Retirement Research at Boston College, July 2014.
- “City of Bridgeport Eliminates $200 Million in Pension Liability; Completes Bond Sale to Save Taxpayers Nearly $50 Million in Debt Service Payments,” Office of Mayor Joseph P. Ganim, Dec. 28, 2017; “City of Bridgeport, Connecticut $99,500,000 General Obligation Bonds (Federally Taxable), 2017 Series D,” Official Statement, Dec. 5, 2017.
- “Mayor Ganim Joins Bridgeport Delegation, CT House Speaker Sharkey, and Senate President Marty Looney to Review Legislative Accomplishments in 2016,” Office of Mayor Joseph P. Ganim, May 24, 2016.
- Denise Nappier, Connecticut State Treasurer, letter to Joseph P. Ganim, Mayor of Bridgeport, CT, “Re: Bridgeport’s Proposal to Modify Contributions to the Municipal Employees’ Retirement System,” May 3, 2016.
- Clare Dignan, “New Haven Alders Halt $250M Pension Bonding,” New Haven Register, May 18, 2018.
- Michael E. Bell, “Overview of Property Taxes in Connecticut,” prepared for the Connecticut Tax Study Panel, Oct. 27, 2015.
- “Mayor’s Proposed Budget for the Fiscal Year End June 30, 2019,” Office of the Mayor of Waterbury, Mar. 28, 2018, p. 21.
- Bridgeport and Waterbury have been left out because their pension costs are difficult to compare with those of the other cities. Much of the annual cost in these two cities is debt service on their pension obligation bonds, which is a flat payment.
- “Comprehensive Annual Financial Report, City of Hartford, Connecticut, Mayor-Council Form of Government, For the Fiscal Year July 1, 2016 to June 30, 2017,” Hartford Department of Finance, Jan. 10, 2018, p. 96.
- “City of Stamford, Connecticut Comprehensive Annual Financial Report, Fiscal Year Ended June 30, 2017,” Stamford Office of the Director of Administration, Dec. 29, 2017, p. 93.
- “City of New Haven, Connecticut Comprehensive Annual Financial Report, Fiscal Year 2017 July 1, 2016–June 30, 2017,” New Haven Department of Finance, Mar. 15, 2018, p. 92.
- Rappa, “Municipal Accountability Review Board Law.”
- State of Connecticut, Office of Policy and Management, Municipal Accountability Review Board (MARB); “Comprehensive Annual Financial Report, City of Hartford, Connecticut, Mayor-Council Form of Government, For the Fiscal Year July 1, 2016 to June 30, 2017,” p. 11.
- “City of Hartford FY2019 Recommended Budget,” Office of Mayor Luke A. Bronin, Apr. 16, 2018, pp. 2-5 and 4-1ff.
- “City of Hartford Municipal Employees’ Retirement Fund (MERF), Actuarial Valuation as of July 1, 2016,” hooker & holcombe, sec. II B, p. 7.
- Stephen Eide, “Connecticut’s Fiscal Crisis Is a Cautionary Tale for New Jersey,” Garden State Initiative and Manhattan Institute, October 2017, fig. 5.
- “City of Hartford FY2018 Adopted Budget,” Office of Mayor Luke A. Bronin, July 1, 2017, pp. 2-3—2-8; Keith M. Phaneuf, “Hartford Must Restructure Debt to Get State Help to Avert Bankruptcy,” ctmirror.org, Oct. 19, 2017.
- Agency for Healthcare Research and Quality, Center for Financing, Access and Cost Trends, 2015 Medical Expenditure Panel Survey—Insurance Component, table II.A.2.h (2016), “Percent of Private-Sector Establishments That Offer Health Insurance by Health Insurance Offers to Retirees by State: United States, 2016.”
- Daniel DiSalvo and Stephen Eide, “The OPEB Off-Ramp: How to Phase Out State and Local Governments’ Retiree Health Care Costs,” Manhattan Institute, March 2016.
- Bureau of Economic Analysis, “Gross Domestic Product by State: Fourth Quarter and Annual 2017,” Table 4. Percent Change in Real Gross Domestic Product (GDP) by State, 2014–2017, May 4, 2018.
- Christopher Keating and Daniela Altimari, “Politicians Trade Accusations over GE Departure,” Hartford Courant, Jan. 16, 2016.
- Marc E. Fitch, “Connecticut Lost $2.6 Billion in 2015 as High-Wealth Residents Moved Out,” Yankee Institute for Public Policy, Dec. 6, 2017.
- Kriston Capps, “Understanding the Great Connecticut Taxpocalypse,” CityLab, Apr. 17, 2018.
- Rute Pinho, “Impact of Limiting the SALT Deduction on Connecticut,” Office of Legislative Research, Jan. 17, 2018.
- “City of Bridgeport, Connecticut, Comprehensive Annual Financial Report for the Fiscal Year July 1, 2016 to June 30, 2017,” Bridgeport Department of Finance, Jan. 10, 2018, p. iii: “New light manufacturing is looking at Bridgeport as a favorite destination. The City's strategy of identifying growth industries such as medical, financial services, construction, and film/media is proving successful…. Over two million square feet of new development is under way and in developmental and marketing stages”; “Comprehensive Annual Financial Report of the City of Waterbury, Connecticut, Fiscal Year Ended June 30, 2017,” Waterbury Department of Finance, Dec. 21, 2017, p. vi: “The Mayor aims to transform the City into a multifaceted locale for advanced technology, niche manufacturing, healthcare, educational opportunities and cultural venues….The Mayor believes that with the presence of a skilled and educated workforce, affordable real estate, and the convenience and culture of city life balanced by the nearby rural beauty of the countryside, the City will continue to draw interest from investors and developers who see Waterbury as a center for business, education and quality of life”; “City of New Haven, Connecticut Comprehensive Annual Financial Report Fiscal Year 2017 July 1, 2016–June 30, 2017,” New Haven Department of Finance, Mar. 15, 2018, p. ii: “New Haven is a city on the rise”; “Comprehensive Annual Financial Report, City of Hartford, Connecticut, Mayor-Council Form of Government, For the Fiscal Year July 1, 2016 to June 30, 2017,” Hartford Department of Finance, Jan. 10, 2018, p. iv: “A series of important developments in 2017 are establishing Hartford as a regional center of innovation and start-up business activity”; “City of Stamford, Connecticut Comprehensive Annual Financial Report, Fiscal Year Ended June 30, 2017,” Stamford Office of the Director of Administration, Dec. 29, 2017, p. ii: “Through sound urban planning, the City has strengthened its downtown retail core, increased its housing stock, and enhanced its cultural facilities, while continuing to attract major commercial office development and new employers.”
- Author calculation based on Western Interstate Commission for Higher Education (WICHE), Knocking at the College Door, “Projections of High School Graduates Through 2032,” Dec. 20, 2017. For Connecticut, the projected decline is from 40,783 to 32,968, or 19.2%; for the northeastern states (Connecticut, Maine, Massachusetts, New Hampshire, New Jersey, New York, Pennsylvania, Rhode Island, and Vermont), the projected decline is from 610,619 to 562,466, or 7.9%.
- All of Connecticut’s five largest cities, with the exception of Waterbury, have at least one strong residential neighborhood. Based on an analysis of Zillow.com, East Rock and St. Ronan–Edgehill in New Haven, Black Rock in Bridgeport, and the West End of Hartford all have several single-family houses currently listed for sale for more than $500,000. (There is not a single $500,000 listing for Waterbury at the moment.) Stamford has dozens of such listings across the city.
- See Hartford.gov, Assessment Division, “Hartford Tax Rate History.”
- “In Connecticut, property is taxed at 70% of its fair market value (i.e., the assessment ratio)”; https://www.cga.ct.gov/2012/rpt/2012-R-0104.htm.
- See “Securing the Future: Service Sharing and Revenue Diversification for Connecticut Municipalities,” Connecticut Conference of Municipalities, Jan. 17, 2017.
- Local income taxes exist in 14 U.S. states; see Morgan Scarboro, “State Individual Income Tax Rates and Brackets for 2018,” Fiscal Fact No. 576, Tax Foundation, March 2018.
Are you interested in supporting the Manhattan Institute’s public-interest research and journalism? As a 501(c)(3) nonprofit, donations in support of MI and its scholars’ work are fully tax-deductible as provided by law (EIN #13-2912529).