Has New York City’s Subway System Improved? A Data-Based Report Card

In June 2017, New York governor Andrew Cuomo declared New York City’s transit system—primarily the city’s subways—to be in a “state of emergency.” Noting that subway “delays are maddening New Yorkers” who are “infuriated by a lack of communication [and] unreliability,”[1] the governor ordered the Metropolitan Transportation Authority (MTA), whose chairperson he nominates and whose board nominations he controls, to reorganize its operations.
Though the long-term goal was for the MTA to modernize its physical assets, including its outdated signal infrastructure, the MTA’s more immediate goal was to better manage its short-term inspection, repair, and replacement schedule for tracks, signals, and subway cars to avoid unexpected disruptions to the schedules of nearly 6 million daily subway riders. The MTA’s task here was partly to repair the damage done by cutbacks to inspections, maintenance, and repairs made in the wake of the 2008 financial and economic crisis—cuts made even as ridership continued to soar as the local economy recovered; and even as the MTA’s budget for pensions, health care, and debt continued to grow. The MTA also announced plans to deploy medical crews more quickly to passengers in need of assistance, thus reducing delays due to sick or incapacitated riders.
Seventeen months into this plan, it is possible to use the MTA’s own performance reports to assess the early results. Each month, the MTA reports information to its board on specific areas of subway performance, including the percentage of subway trains that arrive at their terminal (final destination) on time; the average distance, in miles, that a subway car can travel before breaking down; the number of “major incidents” that disrupted service for 50 or more subway trains at once; and the percentage of weekday passengers’ journeys that arrive within five minutes of the scheduled time.
The good news: over the past three years, the MTA has stabilized its operations, stemming the dramatic declines in performance over the previous half-decade. Indeed, Cuomo was not wrong to note, upon Joseph Lhota’s departure as MTA chairman in November 2018, that Lhota had “stabilized the subway system.”[2]
Nevertheless, the MTA has not yet regained its performance levels of the early 2010s. Despite modest improvements over the past year, nearly three times as many weekday trains experience delays compared with 2011, when Cuomo first took office. Trains are still nearly 30% more likely to break down. The MTA has not stemmed the decline in ridership that resulted from its recent declining performance.
Background
A month after Governor Cuomo’s declaration of emergency in 2017, the MTA, under then-chairman Lhota, launched a “subway action plan,” promising to “deliver improvements within the year.”[3] The MTA would primarily focus on track and signal-system improvements and train-car reliability, deploying hundreds of new workers toward inspecting, repairing, and replacing track segments as well as ensuring that the system’s early-20th-century signal system did not break down as often.
The plan had a steep price tag. Though the MTA never promised a finite time frame for the “action plan,” the first phase was to cost $836 million: $456 million in the form of higher labor and other operating costs for expedited repairs and cleaning; and $380 million in the form of higher capital-asset costs for newer and better track, subway cars, and cleaning and inspection equipment.[4]
But the subway action plan is not a one-off cost. The MTA expects extra operating expenditures attributed to more aggressive inspection, repair, and maintenance schedules to be ongoing. On top of (a revised) $508 million in operating costs for the first year, the MTA expects to spend another $365 million in 2019 and $365 million annually thereafter, largely to pay the wages and benefits of newly hired union employees who will do much of this in-house work.[5] Between 2017 and 2019, for example, the MTA expects that the workforce for New York City Transit (the MTA’s subway and bus division) will grow by 1,095 workers, to 51,246, largely as a result of the subway action plan.
The MTA has also made management changes to ensure professional implementation of the plan. In January 2018, Andy Byford, a veteran of mass-transit systems in Toronto and London, joined the MTA as president of New York City Transit, in charge of subways and buses.[6] In late October, Byford told 60 Minutes’ Bill Whitaker, “I absolutely want New Yorkers to start feeling, by the end of this year, it’s definitely getting better.”[7]
Results
What do the data say about how the MTA has performed since the announcement and gradual implementation of its subway action plan?
Delays
The chief driver of Governor Cuomo’s 2017 emergency declaration was subway delays. In May 2017, a month before Cuomo made his announcement, only 61.7% of weekday subway trains arrived at their final destination on time, down from 69.9% in May 2015, and down from 85.1% in May 2011. This slide over six years meant that passengers on 67,452 trains endured delays in May 2017, up from delays for passengers on 21,732 trains six years earlier, months after Cuomo first entered office.[8]
The good news: since the 2017 nadir, the MTA has improved. On-time train performance hit 70.3% in October 2018, the best figure for more than two years. In October 2018, weekday passengers suffered delays on 56,139 trains, compared with 64,840 in October 2017.
Yet this accomplishment is still modest. From 2010 to late 2013, the MTA consistently performed with more than 80% of subway trains arriving on time each weekday (Figure 1). In October 2013, for example, 34,521 weekday trains experienced delays to their final destination. The October 2018 level was thus nearly 63% higher than five years earlier.
The average for the first 10 months of each of the six years leading up to 2018 shows how much work the MTA must do (Figure 2). For the first 10 months of 2011, trains were on time 85% percent of the time. For the first 10 months of 2016, trains were on time nearly 68% of the time. Despite recent improvements, during the first 10 months of 2018, trains were on time slightly more than 66% of the time.
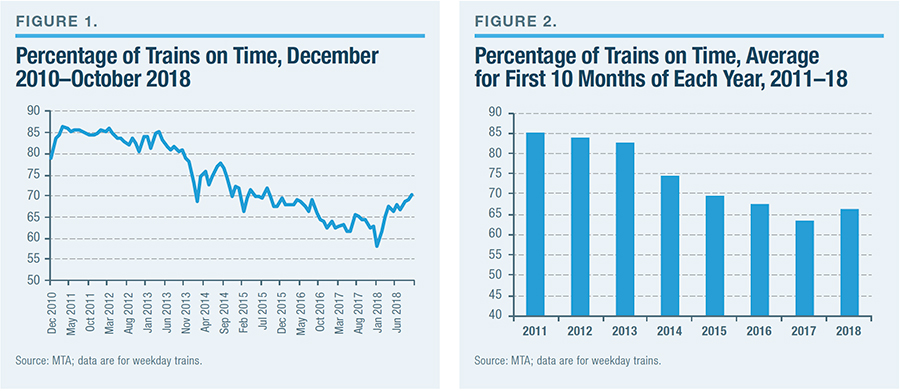
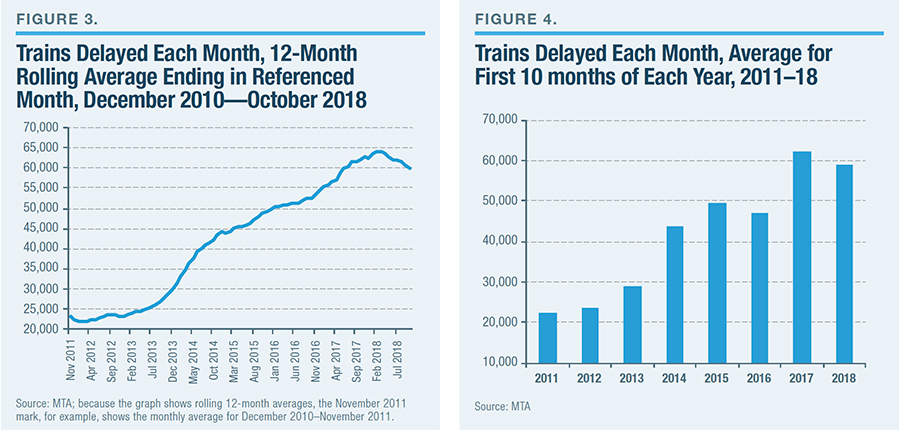
Measured in absolute numbers, today’s subway performance is even worse (Figures 3 and 4). During the first 10 months of 2011, an average of 22,242 weekday trains were delayed each month. During the first 10 months of 2018, an average of 59,136 trains were delayed. Despite an improvement over 2017, performance in 2018—measured by the number of trains delayed—is 166% worse than it was seven years earlier.
Mean Distance Between Failures
Another measure of the MTA’s subway performance is “mean distance between failures”: the distance (in miles) that a subway car can travel before a car “fails” and needs to be taken out of service because of a stuck door, malfunctioning brakes, etc. This measure is important because an unexpected failure of a train car at rush hour can cause significant disruption for passengers who must exit the train on a crowded platform and wait for a new one.
Here, too, the MTA has made recent progress—but not enough to undo years of backsliding (Figures 5 and 6). In early 2011, for example, subway trains could regularly run 170,000 miles or more between failures. By late 2016, subway trains were breaking down after less than 120,000 miles. Over the past year, performance has stabilized and improved slightly; in October 2018, failures occurred every 122,000 miles. The MTA therefore has a long way to go before attaining the performance of just over half a decade ago.

Major Incidents
MTA passengers are all too aware of the phenomenon of “major incidents”: a delay that disrupts service without warning on 50 or more trains at any one time. Such incidents disrupt commutes for tens of thousands of passengers on a given day. On this measure, no discernible trend is apparent during the past three years. (The MTA began measuring this statistic only in January 2015.)
Over the six-month period May–October 2018, for instance, the MTA had a slight improvement: an average of nearly 63 major disruptive incidents each month; down from May–October 2017, nearly 68; and from May–October 2016, nearly 67 (Figure 7). For a longer time frame, however, when comparing the average of the first 10 months, the MTA’s performance in 2018 was not better than in 2016 (Figure 8).

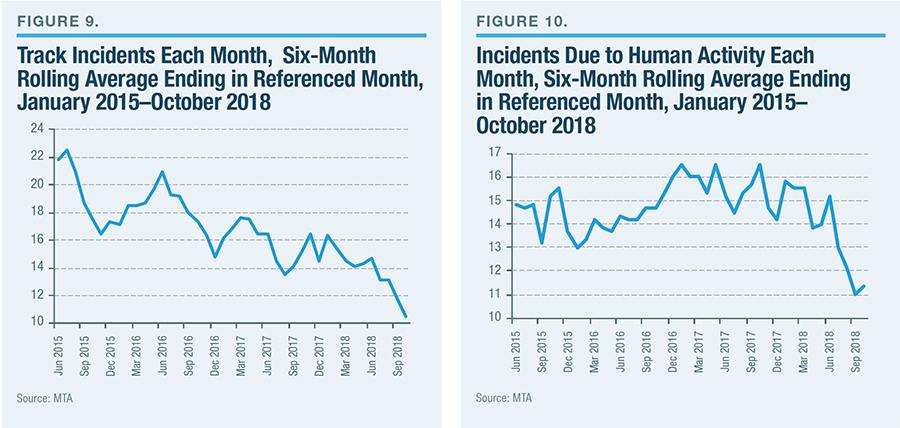
Broken down into categories, however, the MTA appears to have made progress in at least one area: major incidents attributable to track problems (Figure 9). The number of such incidents has steadily fallen, from 18 in the six months ending in October 2015 to 11 in the six months ended in October 2018. Likewise, the number of incidents due to human causes—a sick passenger, a person who has fallen or jumped onto the tracks, or police activity—has steadily fallen, from an average of 15 to 11 over the same period (Figure 10).
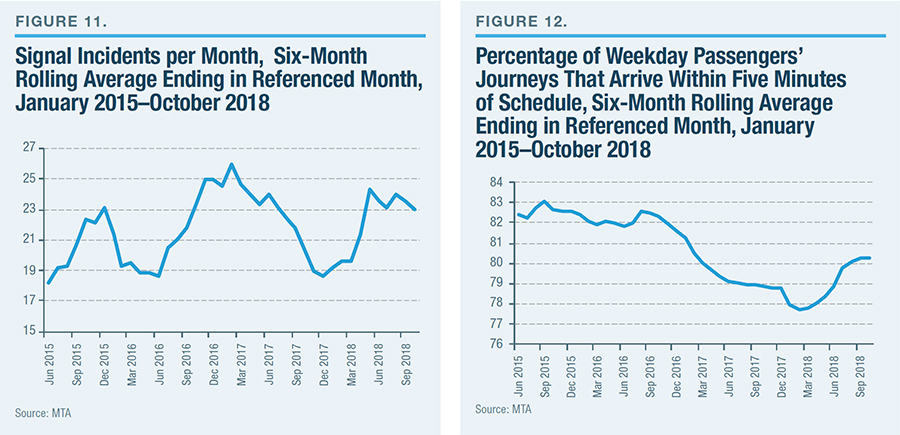
One area has proved particularly intractable. The MTA has not reduced the number of incidents due to signal problems (Figure 11). The figure stood at 23 per month in the six months ended in October 2018, up from 22 per month in the six months ended in October 2015. The stubbornness of signal problems points up the MTA’s need to modernize its pre–World War II signal technology.
Overall Passenger Experience
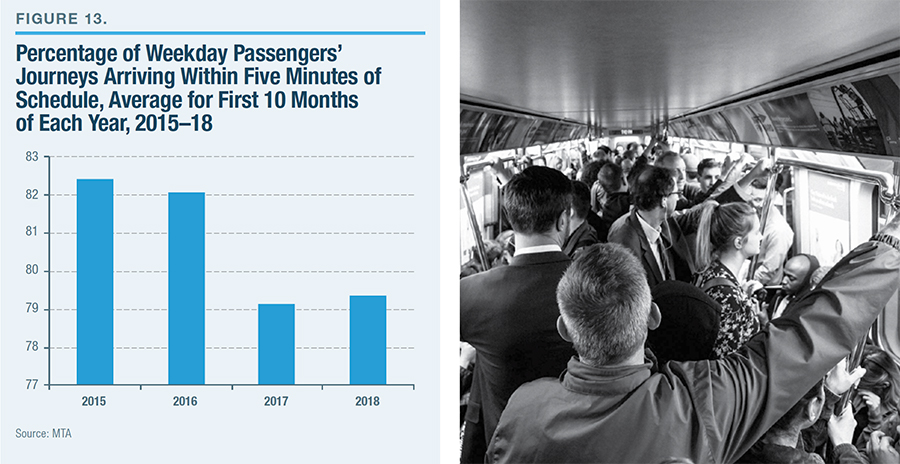
These mixed results point to one reality: riders are not experiencing a radical turnaround on the MTA. In fact, the percentage of rider journeys that end within five minutes of their scheduled time has fallen since 2015 (when the MTA first measured this metric), from 83% in the six months ending in October 2015, to 80% in the six months ending in October 2018 (Figure 12). Over the average of the first 10 months of 2018 compared with the same period in 2015, this figure has fallen a bit, from just above 82% to just over 79% (Figure 13); over the past year, it remained stable.
Ridership
The ultimate arbiter of whether the MTA has halted the decline of New York City’s subway system eventually will show up in ridership. For the 12 months leading up to September 2017, nearly 5.6 million people rode the subway each weekday, down from the record high of nearly 5.7 million for the 12 months leading up to September 2016. Since September 2017, the decline in ridership has continued, with fewer than 5.5 million riders each weekday in the 12 months leading up to September 2018.
Indeed, after more than 20 years of record-breaking ridership leading up to 2016, the rate of ridership decline has accelerated. Over the past year, the rate of decline was 2.2%, 57% higher than the previous year’s rate of decline of 1.4%. The MTA cannot claim to have reversed its operational decline until its customers agree, voting with their feet.
Conclusion
The MTA’s nearly year-and-a-half-old “subway action plan” has yielded modest results. The plan has helped stop the subway system’s precipitous decline of the previous half-decade. Yet the slight improvements that the MTA has eked out over the past year are not enough. The subway system is still not performing close to the levels of more than half a decade ago, when delays, train failures, and major incidents were much rarer than they are today. The MTA has not yet proved that it can keep up with today’s record residential population, record daytime (working) population, and record tourist population.
Endnotes
- “Governor Cuomo Announces $1 Billion in New MTA Funding and Declares State of Emergency to Speed Up Subway Repairs,” NY.gov, June 29, 2017.
- “Statements from Gov. Andrew M. Cuomo and Joseph Lhota,” NY.gov, Nov. 9, 2018.
- “MTA Chairman Joseph Lhota Unveils NYC Subway Action Plan,” NY.gov, July 25, 2017.
- “NYC Subway Action Plan,” MTA, July 25, 2017.
- “MTA 2019 Final Proposed Budget: November Financial Plan 2019–2022,” MTA, vols. 1–2; “MTA Annual Disclosure Statement Update,” MTA, Aug. 2, 2018.
- “Andy Byford Named New President of New York City Transit,” MTA, Nov. 21, 2017.
- “Why Has the New York City Subway Gone off the Rails?” CBS News, Oct. 21, 2018.
- All performance data are sourced from the MTA’s monthly board and board-committee meetings. See, e.g., “Transit and Bus Committee Meeting October 2018,” MTA.
______________________
Nicole Gelinas is a senior fellow at the Manhattan Institute and contributing editor at City Journal. Follow her on Twitter here.
Are you interested in supporting the Manhattan Institute’s public-interest research and journalism? As a 501(c)(3) nonprofit, donations in support of MI and its scholars’ work are fully tax-deductible as provided by law (EIN #13-2912529).