Energy Poverty in New York The Adverse Impacts of the State’s Green Power Mandates

Rising fossil fuel prices since January 2021, recently exacerbated by Russia’s invasion of Ukraine, have revealed the importance of gasoline, diesel fuel and heating oil, propane, natural gas, and electricity to the economy. Not only have higher energy prices created hardships for millions of individuals who struggle to afford to heat their homes; but raising the costs of producing virtually every good and service supplied to businesses and consumers exacerbates the effects of the current inflation caused by the expansionist monetary policies and supply-chain constraints.
Two fundamentally different strategies have been advocated to combat rising energy prices. Ironically, both call for U.S. energy “independence,” by which advocates typically mean not relying on imports of crude oil from hostile and politically volatile regions (e.g., Russia, Venezuela, and the Middle East). One strategy calls for increasing fossil fuel supplies by ending the Biden administration’s policies that are hostile to fossil fuel development. These policies include the cancellation of the Keystone XL pipeline, which would have delivered crude oil from Alberta, Canada, and moratoriums on new drilling permits on federal lands and in the Gulf of Mexico. The other strategy calls for transforming the U.S. economy to rely solely on green and zero-carbon energy resources.
Capitalizing on Russia’s invasion of Ukraine, for example, Senator Edward Markey (D, MA) has said: “This moment is a clarion call for the urgent need to transition to domestic clean energy so that we are never again complicit in fossil-fueled conflict.”[1] Similarly, President Joe Biden touted the rise in gasoline prices as a component of what he termed an “incredible transition” toward less reliance on fossil fuels.[2] For some green energy advocates, the invasion of Ukraine has been, in effect, a “twofer”: it has allowed them to emphasize the need for green energy to rescue the planet from what they term a “climate emergency”[3] and to reduce the country’s exposure to future fossil fuel price shocks.
New York’s policymakers are all in for the second strategy. The state government has been adverse to fossil fuel development and production and has long advocated green energy policies to address climate change. These policies include the “zero-emissions” electricity mandates in the 2019 Climate Leadership and Community Protection Act (hereinafter, Climate Act), preventing upstate communities from rejecting large-scale wind and solar projects, bans on siting new natural gas pipelines, and mandates for “electrifying” end-use energy—vehicles, furnaces, water heaters, and even cookstoves.
These efforts will fail. The Climate Act’s zero-emissions mandates are physically infeasible, and, in any event, the resulting reductions in greenhouse gas emissions would have no measurable impact on the world’s climate. But the attempt to implement these policies will impose damaging hardships for businesses and consumers. Low-income New Yorkers, in particular, are already being hard hit by higher energy prices, a phenomenon known as “energy poverty.”
Energy poverty is not a new concept. In many developing countries, such as in Africa, energy poverty usually has meant a lack of physical access to energy supplies because no energy supply infrastructure exists. In developed countries, energy poverty is about the affordability of energy.
Energy affordability has been a long-standing issue in the Empire State. In the first decade of this century, high prices for natural gas and electricity meant that many New Yorkers spent more than 10% of their incomes—the usual gauge of energy poverty—to heat and light their homes. But thanks to technological advances in hydraulic fracturing (“fracking”), gas supplies boomed, especially in Pennsylvania’s Marcellus Shale play. Production also increased in New York until former governor Andrew Cuomo banned fracking in the state in 2014. Natural gas prices for the state’s residential customers have been increasing since 2016, and electricity prices also continue to increase. Consolidated Edison (ConEd), which provides electric and natural gas service in New York City and Westchester County to about 3.3 million customers, filed for a rate increase in January of this year. If it is approved by the state’s Public Service Commission, residential electricity will cost nearly 30 cents per kilowatt-hour (kWh),[4] more than double the average residential price of electricity in the U.S., which was just above 13 cents/kWh in 2020.[5]
The most recently available U.S. census data show that about 1 million New York households faced energy poverty during 2015–19. The situation today is surely worse. Even if the recent run-up in fossil fuel prices moderates, the state’s energy policies will plunge millions of New Yorkers into energy poverty.
- The ban on fracking in New York, along with an effective ban on new pipelines into the state, has needlessly increased costs for direct natural gas consumption and electricity generation. Mandates to electrify all end-uses of energy, including transportation, space and water heating, and industrial processes likely will double or triple electricity demand.
- The Climate Act requires that 100% of all electricity demand be met with emissions-free resources by 2040. Given the lack of support for constructing new nuclear power plants, this means that the additional electricity supplies needed will have to come from wind and solar power, whether produced in New York or imported from other states. However, the quantity of battery storage and reserve generating resources needed—to compensate for periods when insufficient wind- and solar-generated electricity is available—will have to increase at least fivefold.
- The costs of sufficient battery storage will be staggering, causing electricity prices to soar. Basic economics suggests that a massive increase in demand for battery storage, including millions of battery-powered vehicles, will increase the prices of raw materials needed to manufacture batteries and the prices of the batteries themselves.
- Worse still, proponents of the Climate Act assume that energy technologies that do not exist today, called “Dispatchable Emissions-Free Resources” (DEFRs), will be developed and commercialized before 2040 to ensure that sufficient electricity is always available. Without DEFRs, meeting the increased demand for electricity while achieving the Climate Act’s zero-emissions goals will be physically impossible. A policy mandate that requires the development of nonexistent technology by a certain date is irresponsible, if not delusional.
- Higher electricity prices will further immiserate low-income New Yorkers, millions of whom already face energy poverty. They will also destroy jobs and reduce economic growth.
Introduction
New York has doggedly pursued policies to eliminate the use of fossil fuels and commit the state to a zero-carbon future. This commitment includes billions for renewable energy, such as a $5 billion Clean Energy Fund, prohibiting local communities from exercising “home rule” to block large-scale solar and wind developments, and mandating the development of thousands of megawatts (MW, equal to 1 million watts) of offshore wind power and rooftop solar photovoltaics (PV).
The state also has been hostile to allowing residents to enjoy the benefits of low-cost fossil fuels. In 2014, then-governor Andrew Cuomo announced a ban on hydraulic fracturing in the state, prompted by a questionable study prepared by the state’s Department of Health, which claimed that fracking had significant public health risks.[6] (In 2020, that ban was codified by the state legislature.)[7] The state’s Department of Environmental Conservation has effectively blocked the construction of new interstate gas pipelines.[8] Consequently, New Yorkers (and natural gas consumers in New England generally) have been far less able to benefit from low-cost natural gas supplies made possible by shale gas development.
In 2019, Cuomo signed the Climate Leadership and Community Protection Act (Climate Act).[9] This law commits the state to reduce greenhouse gas (GHG) emissions by 40% below 1990 levels by 2030 and obtain 70% of the state’s electricity needs from renewable resources; generate 100% emissions-free electricity by 2040; and reduce state GHG emissions by 85% below 1990 levels by 2050. It also commits the state to develop 9,000 MW of offshore wind capacity by 2035 and 6,000 MW of solar PV by 2025.
In September 2021, Governor Kathleen Hochul signed legislation that requires all cars and light trucks sold in New York to be zero-emissions no later than 2035 and, “where feasible,” all medium- and heavy-duty trucks by 2045.[10] In January of this year, Hochul announced her support for a state ban on using natural gas in all new buildings, beginning in 2024. She also established a goal of electrifying 2 million homes by 2030, replacing natural gas and oil furnaces and water heaters with electric heat pumps.[11] (A heat pump works like a refrigerator in reverse: it extracts heat from outside air and sends it inside.)
New York’s Climate Act created a Climate Action Council whose role is to set out a road map to achieve the legislation’s goals. In December 2021, the council released its Draft Scoping Plan.[12] Given the goals of electrifying millions of homes and banning the sale of internal combustion vehicles, a key issue will be ensuring that there are sufficient supplies to meet the increased demand for electricity. According to the Draft Scoping Plan, this will require the discovery of new technologies.[13]
The assumption that new technologies can be developed and commercialized on a set schedule is unrealistic; technological innovation typically does not take place on well-defined schedules set by politicians. Moreover, moving a new technology from a laboratory concept to commercialization is typically costly. While technological innovation can reduce costs over time, new technologies (e.g., microwave ovens, personal computers) almost always are costly to begin with, until manufacturing scale economies are realized. And some new technologies (e.g., CDs, videocassette recorders) often themselves become obsolete in short order.
A key issue associated with the state’s mandated energy transition will be the increased costs, especially for residential consumers. Residential energy prices in New York historically have been higher than average prices for the U.S. as a whole (Figures 1–3), especially for electricity, despite the ample supplies of low-cost power provided by the network of hydroelectric dams operated by the New York Power Authority (NYPA).[14]
Wholesale electric prices in New York declined from a high of about $95/MWh (megawatthour, which is one megawatt of power running continually for one hour) in 2008 to just under $26/MWh in 2020. The decline was the result of wholesale natural gas prices, which fell from over $10/MMBtu in 2008 to $1.64/MMBtu in 2020.[15] But while wholesale electric prices fell almost 75%, average residential retail electricity prices increased over this same period, driven by rising costs to transmit and deliver the power, as well as higher taxes on utility bills (Figure 1). Meanwhile, residential natural gas prices also fell between 2008 and 2016 but have been increasing since (Figure 2). The jump in average residential natural gas prices in 2021 was especially pronounced.
Figure 1
Average Residential Electricity Prices, U.S. and New York: 2001–21

Figure 2
Average Residential Natural Gas Prices, U.S. and New York: 2001–21

Because heating oil is primarily used in states along the Atlantic coast and in New England, the differences between average U.S. and New York residential prices are relatively small.
Figure 3
U.S. and New York Residential Heating Oil Prices: 2005–22

The decline in residential natural gas and heating oil prices for New Yorkers between 2008 and 2016 was driven primarily by fracking in the Marcellus and Utica Shale formations that underlie Pennsylvania and western New York.[16] Natural gas and crude oil production increased rapidly in both states (before Cuomo’s fracking ban in 2014), as well as nationwide. Especially for the Marcellus Shale, increases in production outstripped the increase in pipeline capacity to transport natural gas to markets.[17] This reduced the prices that Marcellus producers were able to obtain, further benefiting New Yorkers.
Over this same period, several new pipelines were built to deliver natural gas from Pennsylvania. This benefited consumers, not only through lower natural gas prices but also lower wholesale electricity prices, which, as discussed previously, closely follow natural gas prices. The combination of greater supplies of lower-cost natural gas also benefited the environment, as natural gas-fired generators replaced coal- and oil-fired ones.
The bonanza of low-cost natural gas supplies was short-lived. Not only did the Cuomo administration ban fracking in the state, but it also blocked three new natural gas pipelines that would have increased the ability to import low-cost Marcellus supplies. The combination of increasing demand for natural gas—including the construction of new gas-fired generating facilities to replace the output of the now-shuttered Indian Point Nuclear Facility—coupled with restricting new supplies, has led to higher retail natural gas prices and, more recently, an inability of local gas utilities even to offer gas service to new customers.
As shown in Figures 1 and 2, residential electricity and natural gas prices have increased rapidly since 2016. The increase has been most notable over the past 18 months as domestic production decreased; this has been exacerbated by the Russian invasion of Ukraine earlier this year. In March 2022, for example, average residential heating oil prices rose by almost 20% over February 2022, from $4.15/gallon to $5.08/gallon.[18]
Energy Poverty in New York
Figures 1–3 show that electricity, natural gas, and heating oil prices paid by New York residential consumers all have been above average U.S. prices for several decades. One consequence is that millions of New York residents have experienced energy poverty, even when energy prices were lower than they are today.
Energy Affordability and Energy Poverty
There is no firm definition of energy poverty.[19] However, traditional measures in developing countries have tended to focus on physical access to energy supplies. Although energy affordability is embedded implicitly within traditional energy poverty indices, energy affordability is a secondary consideration; for consumers who lack any physical access to energy infrastructure, or cannot afford their own infrastructure, such as solar panels for lighting, the overall affordability of electricity, natural gas, and so forth is a moot issue. The affordability of energy has often been referred to as “fuel poverty,” although the terms “energy poverty” and “fuel poverty” are sometimes used interchangeably.[20] (For ease of use, I adopt the term “energy poverty.”)
In developed countries like the U.S., physical access to energy resources has not been a policy issue for decades. Electricity, for example, is physically available virtually everywhere. Similarly, the petroleum refining and distribution infrastructure ensures that all consumers have access to gasoline supplies. And, while natural gas is not available to all consumers and businesses (because building local distribution infrastructure is uneconomical in rural areas), substitutes such as propane and butane are available.
Measuring Energy Poverty: Household Income and Utility Expenditures
The primary data source used in this report to measure energy poverty in New York is the U.S. Census 2019 American Community Survey (ACS), five-year Public Use Microdata file, which is available from IPUMS USA.[21] ACS surveys about 3 million addresses and is conducted every year. (The five-year estimates provide greater statistical reliability than a single-year estimate, especially for less populated areas.) For 2019, the overall U.S. response rate was 86.0%. In New York, the 2019 response rate to the survey was slightly lower, 81.2%. The large sample size of ACS, relative to other consumer surveys, allows for statistically significant estimates at the state and county levels. Moreover, ACS includes questions about electricity spending, gas, and heating costs, which make it an especially useful data source.
ACS identifies 21 out of New York’s 62 counties, representing about 85% of the estimated state population, and it also provides data on unclassified locations in the remainder of the state. The overall sample size was more than 375,000 households. In order to develop more accurate estimates of household income and spending on energy and utilities, households reporting negative incomes, households where utility costs were included in monthly rents, and households reporting that they spent nothing on basic utilities (electric, gas, water, etc.) were excluded from the analysis. This left just over 316,000 households in the sample.
To analyze energy poverty rates, the next step is to determine the number of households in each county where expenditures on electricity alone, as well as on combined expenditures of electricity, natural gas, and heating oil, exceeded 10% of total household income, a commonly used threshold measure.[22] Because of New York’s emphasis on policies to electrify end-use demand, I present two different measures of energy poverty: one based on electricity expenditures alone; and one based on expenditures for electricity and expenditures on household consumption of fossil fuels. (Expenditures on transportation-related gasoline and diesel fuel are not included, nor are those data collected by ACS.)
Ideally, energy poverty rates should be based on disposable household income (i.e., net income after accounting for taxes and transfer payments). For most households, disposable income is less than total income. Hence, using total household income will tend to underestimate energy-poverty rates.
ACS does not provide household data on taxes paid (i.e., income taxes, Social Security payments, and property taxes), nor does it provide data on specific transfer payments, such as earned-income and child credits. Therefore, ACS data cannot be used to estimate disposable income. Disposable income estimates can be developed using the Census Bureau’s Current Population Survey (CPS). An analysis of disposable income in the 2021 ACS for reporting New York counties found that disposable income averaged just under 94% of total household income. Unfortunately, the much smaller survey size (about 100,000 households nationwide) means less accurate estimates at the county level, especially in less populated counties. Therefore, for the purposes of this analysis, I have based energy poverty rates on total household income.
As shown in Figure 4, the counties with the highest median household incomes in 2019 are in the New York City metropolitan area. (The exception is Bronx County, which had the lowest median household income of all, at just under $42,000, in 2020.)
Figure 4
New York Median Household Income by County (2019)

Despite the decline in natural gas prices after 2008 that reduced residential natural gas prices and wholesale electricity prices, energy poverty rates based solely on household expenditures on electricity showed that an estimated 2 million New Yorkers faced energy poverty in 2019 (Figure 5). The same data show that, when expenditures for electricity, natural gas, and home heating oil are tallied, about 3.4 million New Yorkers—over 15% of the population—faced energy poverty in that year (Figure 6).
Figure 5
New York State Energy Poverty Rates: Electricity Only (2019)

Figure 6
New York State Energy Poverty Rates: All Fuels (2019)

Tables 1 and 2 list the five counties with the highest electricity-only and all-fuel energy poverty rates. Leading the list is Bronx County, where 24.5% of households spent over 10% of their income just on electricity, and over 28% of the households spent more than 10% of their income on electricity, natural gas, and heating oil combined.
Table 1
The Five New York Counties with the Highest Electric Poverty Rates (2019)
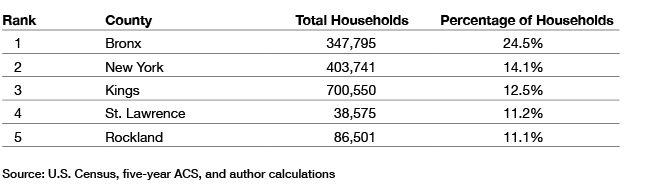
Table 2
The Five New York Counties with the Highest All-Energy Poverty Rates

Importantly, the census data reflect energy poverty rates for the five-year period 2014–19, after residential natural gas and wholesale electricity prices had declined from their previous highs. As energy costs have risen, especially in the last 18 months, energy poverty rates have likely increased as well. Because energy poverty is fundamentally based on household income, higher energy prices have a greater impact on low-income households.
Thus, a key policy question is how the Climate Act’s emissions-reduction mandates, along with the push to electrify the entire state economy, will affect energy poverty in the future.
The Implication of Green Energy Goals for Energy Poverty in New York
In some ways, the Climate Act’s push for mandatory electrification, New York City’s ban on new natural gas hookups, and the state’s ban on sales of internal combustion vehicles beginning in 2035 all mean that reducing physical access to fossil fuels is now a state policy objective. As such, the reliability and affordability of electricity supplies will become increasingly important.
Consider the Climate Act. It directs the state to obtain 70% of its electricity from renewable energy by 2030, including the installation of 6,000 MW of solar PV by 2025; to generate 9,000 MW of offshore wind by 2035; and to add 3,000 MW of battery storage by 2040.[23] By 2040, 100% of the state’s electricity must come from zero-emissions generating resources.[24] By 2050, total state GHG emissions must be 85% below 1990 levels.[25]
In addition, sales of new internal combustion cars and light trucks will be prohibited beginning in 2035, and sales of internal combustion heavy-duty vehicles must end by 2045, if possible.[26] Meeting the 85% emissions-reduction goal also will require that “more than 250,000 housing units each year will need to adopt electric heat pumps and energy efficiency measures from around 2030 onward—more than a tenfold increase from current market activity—with a comparable pace of transformation in the commercial sector.”[27] In other words, the owners of millions of single-family homes and apartments will need to replace gas and oil furnaces, water heaters, and even gas stoves, with electric ones.
One obvious impact of the envisioned transition to electrify the state economy will be the resulting increase in the demand for the electricity needed to replace fossil fuel end-uses. The New York Independent System Operator (NYISO), which oversees the state’s bulk power system, forecasts that electricity demand will increase by up to 75% by 2050 over 2020 levels because of the electrification requirements in the Climate Act.[28] Because fossil fuel generation must be eliminated by 2050, the increased electricity will have to be supplied by emissions-free sources of electricity.
The state currently obtains about 25% of its electricity from two large hydroelectric dams owned by NYPA, as well as several small hydroelectric projects; wood and other biomass provide less than 2% (Figure 7). Although nuclear power previously supplied about 30% of the state’s electricity, prospects for new nuclear power plants are minimal. Much of Indian Point’s output, which supplied about 25% of NYC’s electricity, was replaced primarily with electricity generated by two new natural gas generators, which caused the share of natural gas generation in the state to increase last year.
The state’s three remaining nuclear plants—Fitzpatrick, Ginna, and Nine Mile Point—have been subsidized by the state since 2017, despite opposition from nuclear opponents and ratepayer groups.[29] Those subsidies are supposed to end in 2027. The operating licenses for Fitzpatrick and Ginna expire in 2034 and 2029, respectively. The licenses for the two units at Nine Mile Point expire in 2029 and 2046, respectively. By the end of this decade, the electricity generated by the state’s remaining nuclear plants will drop by about 10,000 MWh, about 8% of the state’s overall supply. The retirement of Fitzpatrick will remove an additional 6,500 MW of emissions-free nuclear power from the generation mix.
In 2021, despite decades of subsidies, wind and solar power combined still contributed less than 5% of the state’s total electricity supplies.
Figure 7
Sources of New York Electricity Generation, 2010–21

Currently, there are no plans to build additional nuclear plants in the state, thanks to significant environmental opposition.[30] There also are no plans to build any additional large hydroelectric dams. Similarly, generation from wood and other biomass is unlikely to increase. Hence, the only real alternatives to meet the projected increase in electricity demand and replace existing nuclear and natural gas-fired generation are wind and solar power, whether from in-state development or imports (Figure 8).[31]
Figure 8
Additional Wind and Solar Generation Required to Meet New York State’s Future Electricity Demand
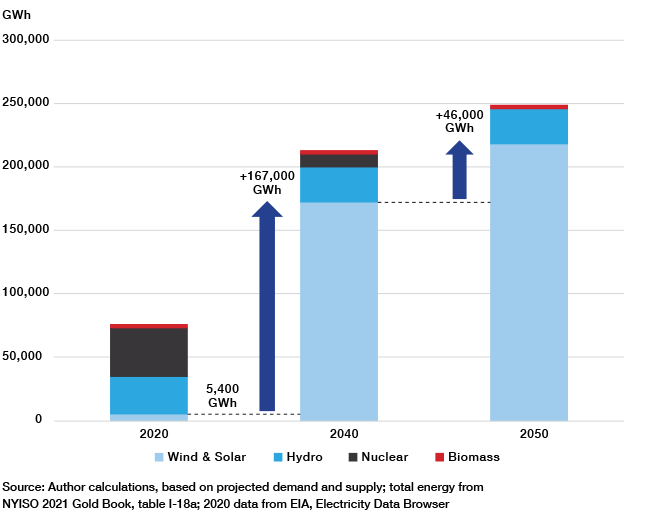
Meeting the zero-emissions requirement for electricity supplies under the Climate Act by 2040 will require increasing generation from wind and solar resources to about 173,000 GWh, a 30-fold increase of more than 167,000 GWh from the 5,400 GWh of electricity generated by wind and solar power in 2020. By 2050, wind and solar generation will have to increase to almost 220,000 GWh, an increase of 46,000 GWh over the required generation in 2040.
The amount of installed wind and solar capacity that this would require is staggering. For example, according to the U.S. Energy Information Administration (EIA), offshore wind has an estimated average annual capacity factor of about 44%.[32] This means that the annual generation actually produced by offshore wind is 44% of what it would be if wind turbines spun every single hour of the year. To generate 172,000 GWh of electricity would require almost 44,000 MW of offshore wind capacity, almost five times more than the capacity in 2035 called for by the Climate Act.[33]
Because onshore wind and solar PV have lower capacity factors, even more capacity would have to be installed. For example, according to NYISO, so-called behind-the-meter or “distributed” solar PV (electricity directly produced and supplied to homes onsite, such as from rooftop panels) had an average annual capacity factor of 12% for 2018–20. In winter, the capacity factor averaged about 6%.[34] (By comparison, in 2020, utility-scale solar PV had an average annual capacity factor of just under 18%.)[35] Depending on the mix of behind-the-meter and utility-scale solar PV in the state, generating 172,000 GWh with solar PV would require over 130,000 MW of solar PV capacity.
Onshore wind has a capacity factor of 25%–40%, depending on its location; the Midwest, for example, is far windier than the Southeast. Moreover, the electrification of space and water heat will mean that electricity demand, which currently peaks in the summer, will peak in the winter,[36] when the amount of electricity from solar PV will be minimal. As discussed below, this will exacerbate the cost of ensuring that there are sufficient alternative resources in reserve to meet peak electricity demand, especially in winter.
In fact, the increased requirements for wind and solar generation estimated above may be too low because the NYISO forecast likely underestimates the increase in future electricity demand. The reason is that the NYISO forecast assumes an order of magnitude increase in energy efficiency savings.[37] However, savings estimates from energy efficiency improvements (e.g., LED lights, more insulation, better windows) typically overestimate actual energy savings because those estimates ignore “rebound” effects.[38] For example, an individual whose home is better insulated may turn up the thermostat in winter because it is less costly to heat the home.
NYISO forecasts that, by 2040, energy efficiency will reduce its base-case winter peak electric demand by 7,000 MW, from about 40,000 MW to about 33,000 MW.[39] Under its high-demand case scenario, which encompasses much of the Climate Act’s electrification mandates, NYISO predicts peak winter electricity demand in 2040 of about 45,000 MW, including energy efficiency savings.
Increased Electricity Demand + Emissions-Free Mandate = Far Higher Electricity Costs
If the Climate Act’s electrification mandates are realized, residential consumers will consume less natural gas and fuel oil but more electricity. Thus, one key question for evaluating future energy poverty is how the costs of electricity will compare with the savings to consumers who no longer use fossil fuels.[40]
Answering that question requires consideration of several factors. One is the cost of the new renewable energy resources themselves—notably, wind and solar PV. Green energy advocates often tout the falling costs of renewable energy supplies, claiming that they are now (or soon will be) less costly than conventional energy resources.[41] These claims have little basis in fact. While the cost of some renewables—notably, solar photovoltaic panels—has decreased over the last decade, extrapolations of ever-decreasing future wind and solar prices ignore basic supply-and-demand principles. Another factor is the necessity of integrating and backing up intermittent wind and solar power onto the high-voltage electric grid to ensure that electricity can be supplied reliably.[42]
The Costs of Providing Backup Supplies of Electricity
Ensuring access to reliable electricity supplies will become even more important under the Climate Act’s electrification mandates. Thus, assuming that policymakers maintain existing reliability standards, this means that the costs associated with backing up intermittent wind and solar power will increase electricity prices substantially and exacerbate energy poverty in the state.[43]
The amount of reserve capacity, called “Installed Reserve Margin” (IRM), needed to integrate large amounts of intermittent wind and solar generation into the grid is substantial. IRM is the percentage of reserve capacity relative to peak demand. According to the New York State Reliability Council (NYSRC), a projected winter peak electricity demand in 2040 of about 38,000 MW will require 50,000 MW of reserve capacity to maintain reliability. Currently, the state needs only 6,600 MW of reserve capacity.[44]
In other words, the IRM would be well over 100%, as opposed to the 20% IRM today. One obvious consequence of a fivefold increase in IRM would be higher electricity costs because owners of that reserve capacity would have to be compensated sufficiently to stay in business. In fact, NYSRC concluded that maintaining reliability would require “substantial clean energy and dispatchable resources, some with yet to be developed technology, over and above the capacity of all existing fossil fuel resources that will be replaced.”[45]
Betting on the Come
In 2020, NYISO prepared a study that examined how to ensure reliability in 2040 (when the Climate Act requires 100% emissions-free electricity).[46] The solution identified in the report was “Dispatchable Emissions-Free Resources” (DEFRs). The study assumed that, in 2040, 10% of electricity in winter would be generated by DEFRs. Similarly, the Draft Scoping Plan states that “zero-emission resources, such as green hydrogen or long-duration storage, will be important to ensuring a reliable electricity system beyond 2040.”[47]
The problem is that DEFRs do not yet exist. Hence, ensuring the reliability of the huge projected increases in wind- and solar-generated electricity that will be needed to meet the mandates for electrification and 100% emissions-free electricity by 2040 rests on an imagined solution.
Some argue that the most likely candidates for DEFRs will be combustion turbines fueled with hydrogen because hydrogen, when burned, does not release any carbon dioxide.[48] While research is under way to convert natural gas–fired combustion turbines to burn hydrogen, turbines that run on 100% hydrogen do not exist today.
Yet even if hydrogen-fueled turbines are developed and commercialized, there is the matter of obtaining the hydrogen needed and the cost of doing so.[49] Today, most hydrogen (called “gray” hydrogen) is produced by burning natural gas, using a process called “steam methane reforming,” which releases carbon dioxide. Burning natural gas to produce hydrogen, which then will be burned in a combustion turbine, is far more costly and carbon-intensive than just burning natural gas in a turbine directly.
Hydrogen proponents claim that the solution is large-scale manufacturing of “blue” or “green” hydrogen. The former is “gray” hydrogen with all the carbon dioxide captured. The latter would be produced using electrolysis—splitting water molecules—using “surplus” wind and solar generation.[50] No large-scale electrolysis facilities to manufacture hydrogen exist today, and the projected costs of producing hydrogen via electrolysis are much higher than the cost to produce gray hydrogen. Nevertheless, the Draft Scoping Plan assumes rapidly declining production costs for hydrogen using electrolysis.[51]
Technological development rarely takes place on an orderly schedule dictated by politicians and policymakers. Hence, assuming that innovative technologies needed to ensure reliable electric supplies will be developed and commercialized in time to meet the Climate Act goals is problematic. But even if these technologies are developed, they are sure to be costly. Moreover, the increase in IRM, even if met with these to-be-developed technologies, means that the prices of electricity—which will have to be high enough to pay the capital and operating costs of reserve capacity—will rise even further.
The Costs of Battery Storage
The Climate Act also calls for the development of 3,000 MW of battery storage by 2040, which could provide about 12,000 MWh of electricity, so-called four-hour storage.[52] (A MW is a measure of instantaneous power flow. A one-MW flow for one hour is one MWh. Typical large-scale battery installations have batteries that discharge over four hours, hence the term “four-hour storage.”) The Draft Scoping Plan states that about 20,000 MW of four-hour and eight-hour battery storage will be required by 2050.[53] This would provide a maximum of 160,000 MWh of backup electricity. Using NYISO’s 2040 forecast winter peak of about 45,000 MW, 12,000 MWh of battery storage would provide less than 20 minutes of backup electricity supply for the state. With a forecast winter peak load of over 50,000 MW in 2050, the 160,000 MWh of battery storage called for would provide just over three hours of backup electricity.
Today, PG&E’s 400-MW Moss Landing facility is the largest battery storage facility in the world and provides 1,600 MWh of electricity. Based on the facility’s $600 million reported cost,[54] providing the 160,000 MWh of battery storage called for by 2050 would cost $60 billion—about $3,000 for every resident of the state. Although many claim that battery storage costs will rapidly decrease over time,[55] prices for lithium carbonate—the key element for storage and electric vehicle batteries—have increased fivefold in the last year.[56] Coupled with increased demand for storage batteries and electric vehicles, the price of battery storage is likely to increase over time, not decrease. For example, the price of a Tesla Powerwall has increased over time[57] and is currently $11,000 (excluding installation). Thus, projections of ever-decreasing battery storage costs are likely based more on wishful thinking and less on sound economics.
The Costs of Upgrading Local Distribution Systems to Accommodate Electrification
Finally, there is the additional cost of reconfiguring local electric distribution systems to accept the envisioned increase of behind-the-meter generation (primarily rooftop solar) and deal with the increase in electricity demand that arises as consumers charge the electric vehicles that the state is also mandating. Although small amounts of rooftop solar can be accommodated on local distribution circuits (i.e., the poles and wires running down streets), accommodating large quantities (say, most of the homes along a given circuit) will require upgrades to ensure that local distribution systems are safe and reliable.
In some cases, the upgrades needed to support more behind-the-meter solar PV are relatively inexpensive; in other cases, they are costly, perhaps $500,000 per circuit.[58] The overall cost would likely be billions of dollars in distribution system upgrades, much of which will be paid by residential customers—including low-income customers—through higher electricity rates.
The costs to upgrade local distribution systems to handle electrification are likely to be far higher. For example, a study conducted by the City of Palo Alto, California, estimated the costs of upgrading the city’s local distribution system to support increased loads caused by electrification.[59] The study estimated that the cost to upgrade would range between $30 million and $75 million for the 15,008 single-family homes in the city, equivalent to $2,000–$5,000 per single-family home.[60] (The study did not estimate costs associated with multifamily units and large apartment complexes.) The study also examined the costs of removing existing natural gas connections and sealing natural gas pipelines as part of the electrification process. These costs were estimated to be between $11 million and $54 million, equivalent to $760–$3,600 per single-family home.[61] Thus, the combined costs of upgrading local distribution systems and removing natural gas infrastructure were estimated to be between $41 million and $129 million, equivalent to $2,800–$8,600 per single-family home.
According to the U.S. Census Bureau, New York State has about 3.2 million single-family homes. New York City has more than 500,000. Using the Palo Alto estimates, this implies upgrade costs of between $9.6 billion and $27.5 billion for the state. For NYC alone, the costs—which would be passed along through the rates that Consolidated Edison charges its customers—would be between $1.4 billion and $4.3 billion. Again, these estimates do not include the costs of upgrading distribution systems associated with multifamily units.
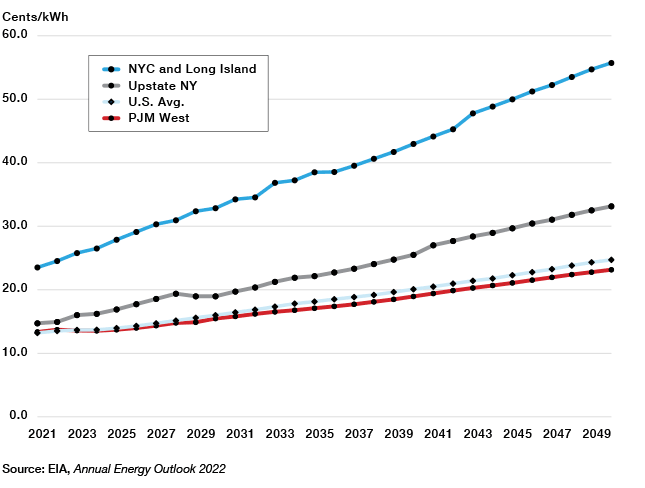
Electricity Price Forecasts
Even without considering the impacts of the Climate Act’s mandates, EIA forecasts that residential electricity rates will increase more rapidly in New York, especially in New York City and Long Island, than in surrounding regions and the U.S. as a whole (Figure 9). Residential electricity prices will average 55 cents/kWh by 2050 for NYC and Long Island (LI), EIA projects, while average residential prices in upstate New York will reach about 34 cents/kWh. Both values exceed the projected U.S. average of about 25 cents/kWh in 2050 and the still-lower average price in the western portion of PJM (a regional transmission organization coordinating the movement of wholesale electricity to many of the mid-Atlantic states).
Figure 9
Projected Residential Electricity Prices, 2021–50
The Draft Scoping Plan estimates that the additional costs to meet the Climate Act’s mandates will cost New Yorkers about $300 billion in present-value terms (2020$), based on $400–$500 billion in additional costs, less avoided fossil fuel costs of $100–$200 billion.[62] That is equivalent to about $16.5 billion per year in inflation-adjusted 2020 dollars—about $800 per person annually.
Although replacing fossil fuel systems in buildings with electric ones and retrofitting homes, apartments, and businesses to be more energy-efficient accounts for about $250 billion in additional costs,[63] energy poverty typically excludes expenditures on new capital equipment, such as furnaces and water heaters. Even omitting those expenditures, the costs to provide end-use heat and hot water using electricity will be greater than the cost of direct combustion of fossil fuels (see sidebar: “Comparing the Costs of Electric and Natural Gas Heat”).
Comparing the Costs of Electric and Natural Gas Heat
To qualify under the federal government’s current Energy Star guidelines, a natural gas furnace or water heater must have an efficiency of at least 90%, i.e., it must convert 90% of the input natural gas energy into useful heat. Air source heat pumps have efficiencies that vary, depending on the outside temperature; as temperatures drop, so does heat pump efficiency because there is less heat available to extract. When outside temperatures are below zero, an air source heat pump will provide little useful heat. A typical air source heat pump efficiency averages 3.0 (300%), i.e., for every kWh of electricity, the heat pump can extract 3 kWh of useful heat energy.[a] (Ground source heat pumps, which require sinking pipes hundreds of feet into the ground to extract heat, have higher efficiency levels but are far more costly.)
In New York City and Westchester County, the average rate per kWh for residential customers varies between $0.25 and $0.30, depending on usage. (This is because ConEd charges residential customers a ready-to-serve charge of $17/month, which is fixed, regardless of usage. So if a residential customer uses 300 kWh/month, the ready-to-serve charge is equivalent to almost 6 cents/kWh; but if the customer uses 1,000 kWh in a month, the ready-to-serve charge is equivalent to 1.7 cents/kWh.)
Using the $0.25/kWh value, an air source heat pump with an average efficiency rating of 3.0 will provide useful heat at a cost of [($0.25/kWh) / (3,412 Btus/kWh) / 3.0] x (1,000,000 Btus/MMBtu) = $24.40/MMBtu.[b]
At an average residential rate of $17/MMBtu, a 90% efficiency gas furnace will provide heat at $17 / 0.9 = $18.89/MMBtu, about 25% less than with a typical heat pump.
Electrification mandates will increase the demand for electricity while decreasing the demand for natural gas. Therefore, the retail price of electricity is likely to increase relative to that of natural gas, further disadvantaging consumers and businesses.
a. To clarify, this does not mean that heat pumps produce more energy than they use, which is impossible.
b. One British thermal unit (Btu) is the amount of energy needed to heat one pound of water by one degree Fahrenheit. One MMBtu is 1 million Btus.
The Climate Act mandates will impose higher costs on New Yorkers, as even the law’s proponents admit. That, in itself, might not lead to higher rates of energy poverty—but only if household incomes can be expected to increase faster than household energy bills. However, high-cost mandates will tend to immiserate ordinary New Yorkers and thus exacerbate energy poverty.
Higher energy costs exacerbate inflation. In Germany, for example, soaring electricity (and, more recently, natural gas) costs have caused some energy-intensive businesses to relocate outside the country, while many other businesses question whether they can survive.[64] As energy costs increase, economic growth decreases, which puts downward pressure on inflation-adjusted household earnings. Put simply, individuals do not benefit from higher energy costs.
Conclusions
New York’s energy mandates will exacerbate energy poverty in the state. Even proponents of the state’s Climate Act admit that the green energy and electrification transition that they envision will have a cost—about $300 billion in present-value terms between now and 2050. The prices that New Yorkers pay for energy will become increasingly unaffordable for millions of residents.
Proponents nevertheless claim that the Climate Act will create a “green” economic renaissance that will create millions of new high-paying jobs and will provide even larger environmental benefits in the form of reduced GHG emissions and air pollution. That claim does not withstand scrutiny. EIA reports that total energy-related CO2 emissions in New York were about 175 million tons in 2018,[65] just over 3% of the estimated 5.3 billion tons of U.S. energy-related CO2 emissions.[66] Total world CO2 emissions in 2018 were estimated to be 34 billion metric tons.[67] Thus, in 2018, New York’s CO2 emissions accounted for just 0.5% of world emissions. Consequently, the Climate Act’s mandates will have zero measurable impact on world climate, even if those mandates can be met. However, given the physical and economic realities of doing so, those mandates will not be realized, barring the discovery and commercialization of entirely new technologies. This report, therefore, recommends that:
- First and foremost, the state should rescind the 2014 ban on fracking, which has been the subject of much fearmongering by environmentalists. In issuing his ban, former governor Cuomo cited the alleged health impacts of fracking discussed in a study prepared by the state’s Department of Health, especially contamination of drinking-water supplies.[68] But a 2015 study released by the federal Environmental Protection Agency refuted the water contamination allegations.[69] Moreover, there is little doubt that the primary reason for reductions in CO2 emissions in the U.S. has been the displacement of coal-fired generation with natural gas. Allowing fracking in the state, along with new interstate natural gas pipelines, would reduce natural gas and electricity costs, reducing energy poverty. Allowing fracking would also provide a much-needed economic boon to upstate New York, which has been mired in economic doldrums for decades.
- Second, the state should abandon its ill-conceived electrification policies, which will be hugely expensive and have little or no environmental benefits, while burdening residents and businesses with the costs associated with replacing furnaces and water heaters. The state should also rescind its 2035 ban on the sale of internal combustion vehicles. The environmental benefits of this mandate would be minuscule and likely to exacerbate air pollution. The mandate is also likely to harm lower-income New Yorkers. The reason? Once the ban is in place, the demand for used internal combustion vehicles is likely to increase, which will raise their prices. Far better to let individual New Yorkers make their own choices regarding the types of vehicles that they wish to purchase.[70]
- Third, the state should abandon its offshore wind and solar PV mandates. The high cost of offshore wind will raise electricity costs, as will the cost of upgrading local distribution systems to accommodate solar PV. Plus, the inherent intermittency of these resources will require massive investments in battery storage and so-called DEFRs, which do not yet exist.
- Fourth, if New Yorkers desire increased supplies of emissions-free electricity, the state should welcome new nuclear power plants, which, unlike wind and solar, provide continuous supplies of electricity. Embracing more nuclear power—especially small, modular reactors—would eliminate the need to develop massive quantities of battery storage and DEFRs.
New York’s Climate Act mandates are infeasible and would, in any event, have no measurable impacts on world climate. Instead, the state would do well to invest in measures to adapt to whatever climate change may occur, such as improved seawalls and relocating critical infrastructure away from flood-prone areas. The latter’s costs will be far less than the former and will not compromise access to reliable, affordable energy.
About the Author
Jonathan Lesser has more than 35 years of experience working for regulated utilities, for government, and as a consultant in the energy industry. He has addressed economic and regulatory issues affecting energy in the U.S., Canada, and Latin America. Those issues include gas and electric utility structure and operations, generating asset valuation under uncertainty, cost-benefit analysis, mergers and acquisitions, cost allocation and rate design, resource investment-decision strategies, cost of capital, depreciation, risk management, incentive regulation, economic impact studies, and energy and environmental policies.
Lesser has prepared expert testimony and reports for utility commissions in numerous states; for the Federal Energy Regulatory Commission; for international regulators; and for commercial litigation cases. He has testified before Congress and many state legislative committees on energy policy and regulatory issues. He is also the author of numerous academic and trade-press articles and coauthor of three textbooks.
Lesser earned a BS in mathematics and economics from the University of New Mexico and an MA and a PhD in economics from the University of Washington.
Endnotes
Are you interested in supporting the Manhattan Institute’s public-interest research and journalism? As a 501(c)(3) nonprofit, donations in support of MI and its scholars’ work are fully tax-deductible as provided by law (EIN #13-2912529).