College Affordability Update: Value, Price, and Choice in U.S. Higher Education

In 2015, Lumina Foundation introduced the Rule of Ten, a new method for assessing college affordability for students in the U.S.[1] The rule rests on the assumption that an “affordable” cost for college should not exceed the total of: (1) what a student and his family can save by putting away 10% of their income for the 10 years before enrollment; and (2) a student’s earnings, working 10 hours per week while in college.
In 2017, we published a report comparing actual student expenses in 2011–12, based on data from the U.S. Department of Education’s National Postsecondary Student Aid Survey (NPSAS), with those recommended by the Rule of Ten.[2] We found that college exceeded the Rule of Ten’s recommended level for most students in the U.S.; that expenses over the rule’s affordability ceiling were paid for by students’ part-time earnings as well as by debt; and that students from the wealthiest households disproportionately attended the highest-cost institutions and amassed the most debt.
This paper updates our earlier analysis with the most recent NPSAS data. We find that, in 2015–16, students from the wealthiest households continued to attend the priciest institutions and continued to take on the most debt. This suggests that many students prefer higher short-run costs in exchange for higher expected long-run returns (often in the form of better-paying jobs). Thus, efforts to assess college affordability that ignore long-run returns and focus exclusively on short-run costs paint an incomplete picture of the value delivered to students.
Other findings include:
- In 2015 –16, students seeking bachelor’s degrees faced an average net cost, including living expenses, of about $85,000 for the entirety of their degrees—or about $6,000 more than in 2011–12.
-
In 2015 –16, students seeking associate’s degrees faced an average net cost for their degrees of about $22,000—essentially unchanged from 2011–12.
-
In 2015–16, students from households in the highest income quartile (those with incomes above $120,000) borrowed about $10,500 more than students from households in the lowest income quartile (those with incomes below $30,000). In 2011–12, the borrowing gap was $7,500.
-
Between 2011–12 and 2015–16, college became slightly more affordable, as measured by the Rule of Ten, for students seeking bachelor’s degrees as well as associate’s degrees.
Paying for College
College costs are generally reported on an annual basis. In this report, however, all cost figures are reported as the total cost for obtaining a particular degree, assuming that students take only the prescribed length of time to graduate. The average net cost of an associate’s degree in the U.S. was largely unchanged between 2011–12 ($22,039) and 2015–16 ($22,044).
While costs stayed flat for students seeking associate’s degrees, there was a sizable decline in borrowing between the two survey years. In 2011–12, students borrowed an average of $4,717; in 2015–16, they borrowed $3,725. This difference was more than offset by an increase in earnings from work—i.e., students financed their educations with less debt and higher earnings while enrolled. Earnings while enrolled increased by $2,523, to $13,843. One reasonable interpretation of this finding would be that the increase in earnings reduced students’ reliance on debt. It is also possible that reduced access to debt drove students to earn more while they were enrolled, through higher wages or longer hours.
By contrast, the net cost of a bachelor’s degree rose $6,131, to $84,905 from 2011–12 to 2015–16. Note that both the average cost and the observed increase do not reflect an index of prices available to students. Instead, they reflect patterns of enrollment across higher- and lower-priced options. For example, even if prices charged by colleges were unchanged, we would still see an increase in average net cost if a larger share of students elected to enroll in relatively higher-cost programs.
The increase in the net cost of a B.A. was accompanied by an increase in borrowing. Estimated average borrowing over the course of the degree increased from $25,090, in 2011–12, to $26,201, in 2015–16. Students in 2015–16 also reported lower levels of earnings than students in 2011–12. The combination of a slight increase in debt and a decline in earnings meant that students were financing a larger share of the expense of college out of savings or current income.
Being saddled with mountainous debt is often depicted as an unavoidable fate for low-income students who desire a college education in the U.S. Our findings paint a more complicated picture.
Borrowing increased for students across all income categories. But the biggest increase was seen among the most affluent students. Students from households with annual incomes exceeding $120,000 borrowed, on average, an estimated $25,500 over the course of the degree program—up by about $5,000 from 2011–12. Students from families in the highest income quartile borrowed about $10,500 more, on average, than students from the lowest income quartile. (While high-income students are less likely to borrow, they tend to borrow much larger amounts than other students.)
Why would affluent students take on so much debt? First, as noted, the children of well-off families tend to choose higher-cost institutions and to complete four-year degrees. Second, well-off families are usually better placed to take advantage of the arbitrage opportunity offered by federal student loans—i.e., borrowing at subsidized interest rates and investing any cash that this frees up in a higher-return investment, such as retirement savings.
To be sure, affluent students still face sizable out-of-pocket bills even after their college loans have been applied: the average amount that such students pay from savings and current income nearly equals the average net cost of a bachelor’s degree. This indicates that many of these students could find a program of study to attend that would leave them debt-free but instead choose to enroll at a higher-cost institution. For these students, minimizing tuition costs is clearly not the objective; rather, it is maximizing their long-run financial returns (or some nonmonetary objective) from college.
As discussed in our 2017 report, college selectivity plays an important role in pricing and affordability. Selective institutions charge a considerable premium over less selective institutions (Figure 1).
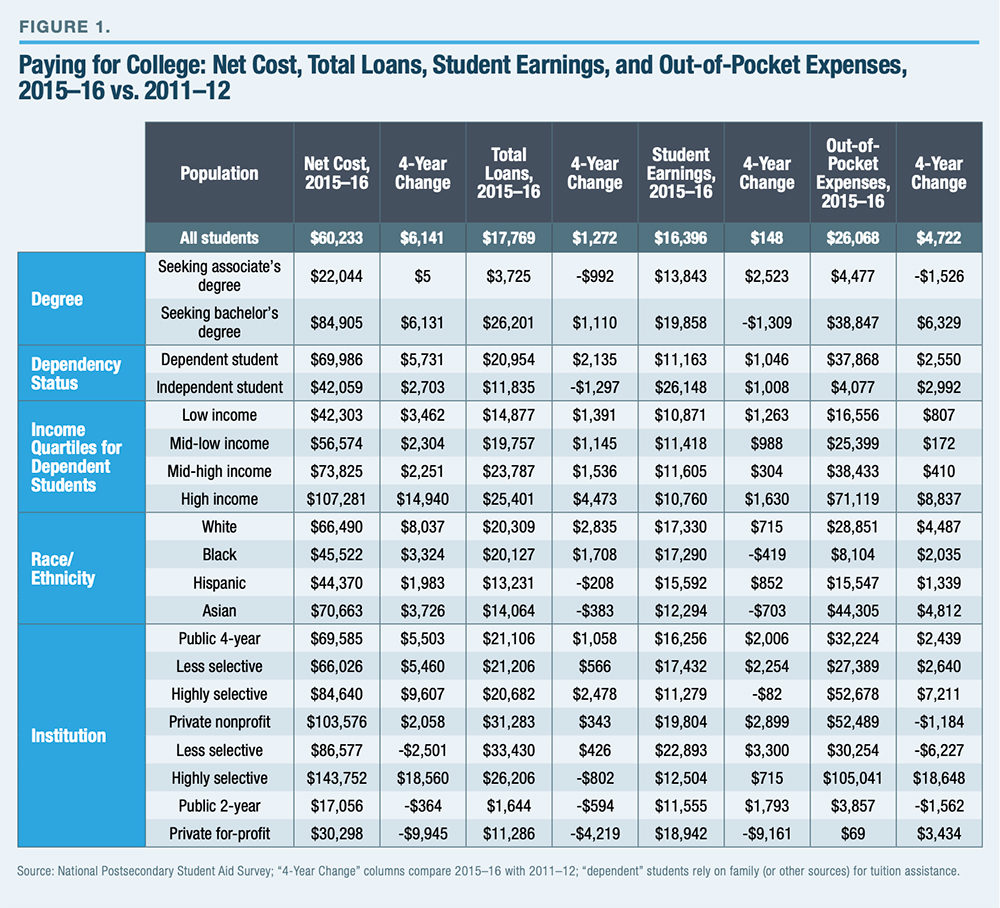
In 2015–16, the average net cost of a bachelor’s degree at a highly selective public institution was $84,640, compared with $66,026 at a less selective public institution—a premium of almost $20,000. The premium is even greater for private nonprofit institutions. The average net cost of a bachelor’s degree at a highly selective private nonprofit is $143,752—more than $57,000 greater than a less selective one.
Measuring Affordability
In our 2017 report, we warned against using simple tallies of student spending on college as a proxy for affordability: in an age of easy access to subsidized credit, we argued that the most pertinent measure of affordability, for students and policymakers, is the long-run value of a degree relative to its price. Yet we also acknowledged that credit constraints (as well as perceived credit constraints created by aversion to debt) may affect access to, and enrollment in, higher education. As such, it is worthwhile to examine how short-run affordability (i.e., college cost relative to income) has changed over time.
The Rule of Ten—which, as noted, suggests an “affordable” level of expense for college based on an individual’s finances—offers a useful benchmark for comparing how the challenge of paying for college has evolved.3 When we compared actual student spending in 2015–16 with the affordability ceilings set by the Rule of Ten, the share of students whose spending exceeded the affordability threshold decreased by 3 percentage points (Figure 2)— i.e., college was affordable for more students in 2015–16 than in 2011–12.
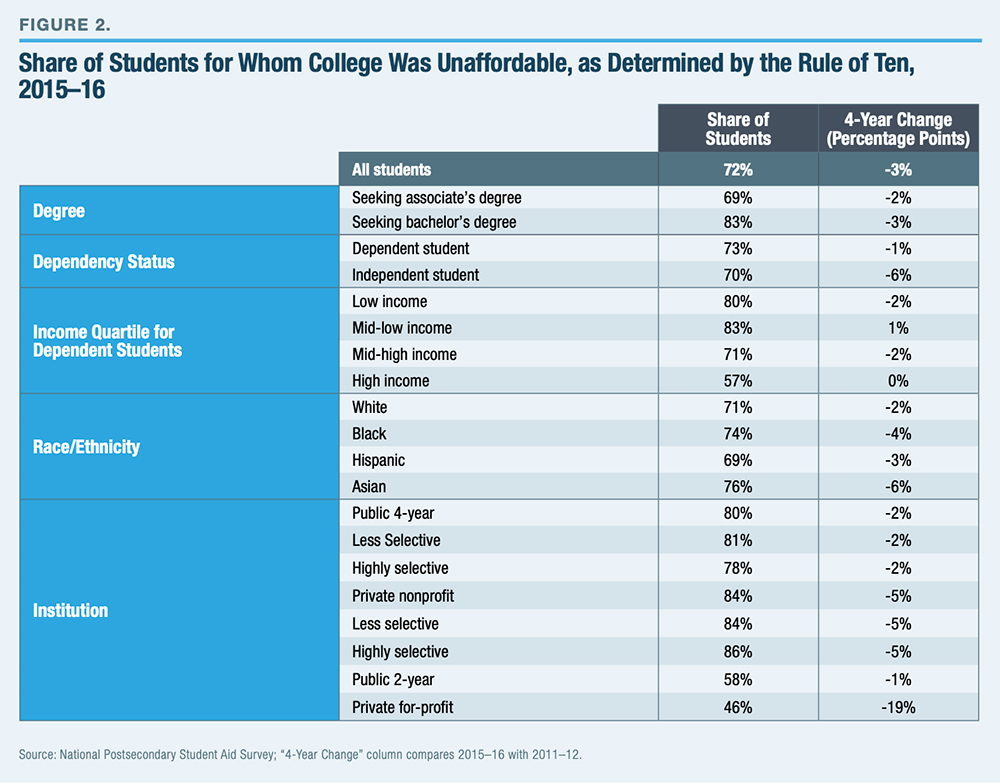
The main cause? Students’ greater ability to pay in 2015–16 (because of higher family incomes and greater earnings from work while in school) more than offset the higher cost of college in 2015–16.
Conclusion
The 2015–16 NPSAS reveals a similar story to the one that emerged in our previous analysis of the 2011–12 NPSAS. In 2015–16, students from the highest-income households continued to attend the highest-cost institutions and continued to borrow the most, too. This is consistent with the hypothesis that students make choices about enrollment that optimize the long-run return of their investment. It also highlights the need to consider the long-run returns—as well as short-term enrollment costs—of higher education when examining “affordability.”
Endnotes
Acknowledgment
The authors thank Lumina Foundation for its generous support. The views expressed are those of the authors and do not necessarily reflect the views of the foundation, its officers, or employees.
Are you interested in supporting the Manhattan Institute’s public-interest research and journalism? As a 501(c)(3) nonprofit, donations in support of MI and its scholars’ work are fully tax-deductible as provided by law (EIN #13-2912529).