Beyond Bailout Federalism: The Case for Nationalizing Entitlements

During the Covid-19 pandemic, Congress provided over $1 trillion in emergency aid to state governments, fearing that their revenues would collapse while Medicaid and Unemployment Insurance (UI) costs surged. But state tax revenues actually increased during the period, and Medicaid expenses fell as Americans avoided hospitals. States therefore received, and have spent, an enormous windfall, all while the federal deficit continued to soar.
In the early 20th century, aid for the poor was largely funded by local property taxes. This financial arrangement collapsed in the Great Depression under the strain of rising unemployment and falling property values. As Franklin Roosevelt’s Democratic Party was a diverse and unwieldy coalition, the New Deal mostly relied upon grants-in-aid for states to distribute federal funds to the elderly, disabled, blind, unemployed, or widowed mothers who needed assistance.
Following the Civil Rights revolution, benefits for the elderly were nationalized, with the creation of Medicare and Supplemental Security Income (SSI). But states retain substantial financial and operational responsibility for Medicaid and UI. These costs—unlike expenditures on education, transport, and law enforcement, which are stable over time—vary with the business cycle and account for the bulk of states’ fiscal fragility. In every recent recession, states have received federal bailouts to cover Medicaid and UI costs. This has encouraged states to overextend their Medicaid commitments in healthy fiscal times, knowing that federal aid will be forthcoming when the business cycle takes a downturn.
The lack of a cap on federal matching funds for programs such as Medicaid also allows states to shift costs to the federal government even without a bailout. For instance, all states now tax hospitals and other medical providers to inflate matching aid that they may claim from the federal government, and they use the profits to improve their general fiscal situation.
Uncapped matching funds offer an extraordinary return on investment for any state—and the wealthiest have been able to go furthest in taking advantage of them. The richest states therefore receive the most federal aid to provide health-care and welfare benefits to the poor, even though poorer states have many more residents who need assistance. As poorer states also have fewer wealthy residents, they must impose higher taxes on poorer residents in order to fund basic safety-net services.
Entitlements can be provided most robustly and cost-effectively if they are administered and financed nationally. This would avert the need for bailouts of states in recessions and eliminate the ability of politicians to overextend programs by shifting costs to taxpayers outside their state. By tailoring benefits to the needy, federal control would also reduce the need to extend taxes beyond the rich.
To eliminate these problems, the federal government should assume full financial and operational responsibility for major entitlements. UI should be fully nationalized, as should the financing and administration of basic Medicaid benefits. State supplements to these benefits should be funded entirely out of state taxes, as they currently are for SSI. As the federal government already pays the full expense of SSI, Disability Insurance (DI), and the Supplemental Nutrition Assistance Program, or SNAP (food stamps), eligibility criteria for these programs should also be fully nationalized.
Another Shock, Another Bailout
The Covid-19 pandemic was immediately viewed as a major threat to the solvency of U.S. state governments. States anticipated plunging revenues, along with soaring claims for Unemployment Insurance (UI) and Medicaid, and pressed Congress to bail them out.
On March 18, 2020, Congress provided a $50 billion hike in federal funding for state Medicaid programs. Nine days later, on March 27, it enacted the CARES Act—providing $260 billion in additional federal funds for unemployment benefits, along with an enormous $340 billion grant of emergency aid to states.[1] On April 11, the National Governors Association called for an additional $500 billion in “unrestricted fiscal support” from federal taxpayers.[2]
But state revenues never plummeted as feared, while state spending on Medicaid actually declined as patients avoided elective procedures.[3] In fact, states captured much of the $1.7 trillion CARES Act and $900 billion end-of-year pandemic relief spending in higher tax revenues.[4] State own-source revenues in 2020 ended up higher than they had been in 2019; and by the second quarter of 2021, state tax revenues had risen 12% from their pre-pandemic level, after adjusting for inflation.[5]
Undeterred, the newly elected Democratic Congress in March 2021 passed an additional $350 billion emergency aid package for state and local governments.[6] Flush with bailout funds and rising tax revenues, states set about expanding their spending commitments.[7]
This dynamic—of states overextending themselves in healthy fiscal times and then relying on national bailouts when the business cycle takes a downturn—has enabled states to systematically shift costs to the federal government. The federal government has encouraged this tendency by providing partial funding for entitlements such as Medicaid and UI. But this arrangement has led to program funds being inequitably distributed, poorly targeted at those who most need assistance, and destined to fall short in recessions, when they are most needed.
The Great Bailout
For most of American history, social welfare policy was largely the responsibility of local government—funded primarily through property taxes. While the federal government could draw upon tariff revenues, states lagged well behind local and federal government in terms of resources (Figure 1). From 1900 to 1930, roughly two-thirds of public welfare spending was by local government, a quarter by states, and the rest by the federal government. But in total, welfare spending amounted to less than 0.2% of gross national product.[8]
Figure 1
Own-Source Revenue, by Level of Government

The Great Depression exposed the inadequacy of state and local responsibility for aiding those who were unable to work. From 1929 to 1932, GDP fell by 46% nationwide, while unemployment soared from 3.2% to 23.6%.[9] The worst effects were highly concentrated. For example, as automobile production slumped by 80%, unemployment rose to 50% in Cleveland and 80% in Toledo.[10]
From 1930 to 1934, state and local spending on Old-Age Assistance (OAA) rose from $2 million to $32 million, with the number of recipients rising from 11,000 to 235,000.[11] Yet, public assistance relied heavily on local property-tax revenues, which not only failed to keep up with needs but were declining—particularly in areas hardest hit by unemployment increases.[12] Personal income taxes had been established in 21 states to help fill the shortfall, but the median income tax accounted for only 3% of state revenue in 1930, and this had fallen by half by 1932.[13] Overall state and local revenues fell from $6.8 billion in 1930 to $5.7 billion in 1932.[14]
As the economy contracted from 1929 to 1932, the tax burden increased from 12% to 21% of GDP—almost entirely at the state and local levels. With property taxes accounting for 90% of major cities’ revenue and real-estate values increasingly diverging from households’ ability to pay, delinquency increased.[15] Caps on property taxes were established in 19 states and many more localities.[16]
States not subject to legal limits on borrowing were burdened by debt, rising interest rates, and the difficulty of finding solvent banks willing to lend.[17] States mostly met acute relief needs by cutting back on existing spending. From 1930 to 1932, state expenditures on public works were reduced from $1.3 billion to $0.6 billion in 1932, while cuts to education budgets ranged from 32% in New Hampshire to 53% in Wyoming.[18] In 1932, South Carolina, Arkansas, and Louisiana were beginning to default on their debts.[19]
The unifying priority of the New Deal Democratic coalition in Congress was less shared ardor for any particular social or economic theory, than it was the urgent need to bail out state and local governments.[20] Total spending across all levels of government had surged from 11.7% of GNP in 1927 to 21.4% in 1932, as the economy shrank; but it actually fell slightly over the course of the New Deal, to 20.5% in 1940.[21]
Figure 2
Public Welfare Spending, by Level of Government

Initially, increased spending in response to the Depression came from local governments; but after 1933, the expansion of effort was largely the result of federal grants to states. Thanks to the direct effects of federal aid and the incentive to impose sales taxes to qualify for federal matching funds, state spending on public welfare would increase from $27 million in 1927 to $945 million in 1940.[22] In 1932, states spent five times less on public assistance than local government; by 1936, they had spent more—an arrangement that would endure (Figure 2).
From 1913, the Sixteenth Amendment to the U.S. Constitution permitted Congress to levy a direct federal income tax, providing the national government a much deeper pool of potential revenue than was available to state or local government—thereby transforming the relationship between them.[23] In 1921, Congress enacted the Sheppard-Towner Act, providing federal grants-in-aid for states to support health care for mothers and their children. Two years later, in Massachusetts v. Mellon, the Supreme Court upheld the arrangement—encouraging a practice that had already been applied to support highway construction, vocational education, and public health.[24] From that point, federal power grew rapidly as a complement to state power.
Grants-in-aid to states became the policy approach of first resort under the administration of Franklin Roosevelt. With state party organizations exercising great control over congressional delegations, this enabled the Democratic Party to hold together a diverse and unwieldy political coalition of western farmers, urban Catholics, southern segregationists, and black voters from northern cities. Delegating the distribution of funds to states allowed programs to accommodate the often-conflicting local needs of machine politics in the North and Jim Crow in the South. The system was also insisted upon by politically pivotal Southern Democrats, who chaired many of the most influential congressional committees.[25]
During the 1930s, Congress established 16 new grant-in-aid programs for states, and cooperatively administered programs accounted for 75% of the increase of nonmilitary federal spending. The Federal Emergency Relief Administration, Civilian Conservation Corps, Works Progress Administration, Agricultural Adjustment Administration, Public Works Administration, Federal Surplus Relief Corporation, and Public Roads Administration all operated through appropriations of funds by the federal government for states to spend.[26]
Of the seven major programs established by the Social Security Act of 1935, six would be structured as split state-federal arrangements. For Aid to Dependent Children, states received $1 of federal funding for every $2 of state spending, up to a per-capita cap. For OAA, Maternal and Child Welfare, and Aid to the Blind, states received $1 of federal funding for every dollar of state spending, up to specified per-capita caps. Roosevelt specifically vetoed attempts to vary matching funds to make up for differences in state fiscal capacity, protesting: “Not one nickel more, not one solitary nickel. Once you get off the 50-50 matching basis, the sky’s the limit, and before you know it, we’ll be paying the whole bill.”[27]
A block grant to states was established to fund the Public Health Service, and a payroll tax was established to finance unemployment compensation, which states could displace by establishing similar arrangements.[28] To be eligible for federal funds, the Social Security Act required states to make these welfare benefits uniformly available on a statewide basis.[29] Subsequent legislation substantially increased matching rates and established similar grants to aid the disabled.
The 1950 Social Security Amendments established federal “vendor payment” matching funds for states to subsidize providers of medical care to the poor.[30] At first, these payments were subject to per-capita caps, but these were removed in the matching grants to fund health care for the elderly poor established by the Kerr-Mills Act of 1960. In 1965, Medicaid copied that structure as it broadened the matching funds to all age groups—effectively eliminating caps on the amounts that states could claim from the federal government for health-care spending.[31] States that implemented Medicaid were allowed to use its uncapped matching rates to claim funds for Aid to Families with Dependent Children (AFDC) benefits.[32]
Social Security’s Old Age and Survivors Insurance (OASI) program was the only purely federal entitlement established during the New Deal. The rationale for federal administration of OASI was that its benefits were supposed to be tied to an individual’s payroll tax contributions, which may be made in multiple states. But the program initially paid out only small amounts, and these were eroded by wartime inflation. Federal OASI expenditures in 1948 were still less than a quarter of those spent by state and local government on public welfare programs.[33] The size and scope of federal OASI benefits repeatedly increased in the 1950s, when coverage was also extended to disability.
Following the Civil Rights Act of 1964 and the Voting Rights Act the following year, many of the political obstacles to the establishment of federal entitlements were swept away. Congress in 1965 enacted Medicare as a purely federal benefit—and the program’s finances were immediately employed to push Southern hospitals to desegregate.[34] In 1972, Congress replaced federal matching funds for states to aid the elderly, blind, and disabled poor with Supplemental Security Income (SSI), a uniform fully federal benefit.[35] In the early 1970s, food stamp financing and eligibility were largely federalized, and the Earned Income Tax Credit was established as a fully federally financed program.[36] Federal courts increasingly decreed national standards to which AFDC benefits and eligibility criteria had to conform.[37]
Yet the Great Society also saw a great expansion of what Lyndon Johnson labeled “creative federalism.”[38] The federal government increasingly used state and local government—being more attuned to local political dynamics—as subcontractors and agents. The number of categorical grants-in-aid programs tripled from 1960 to 1975, with 109 programs being created in 1965 alone.[39] By 1980, almost all subnational government activity was funded in part by some form of federal aid.[40] The number of grant programs was trimmed from 541 to 405 during the Reagan administration’s first term. But within two years of Reagan leaving office, the number grew to a record 557; and by 2018, state and local governments could apply for 1,274 federal grant programs.[41]
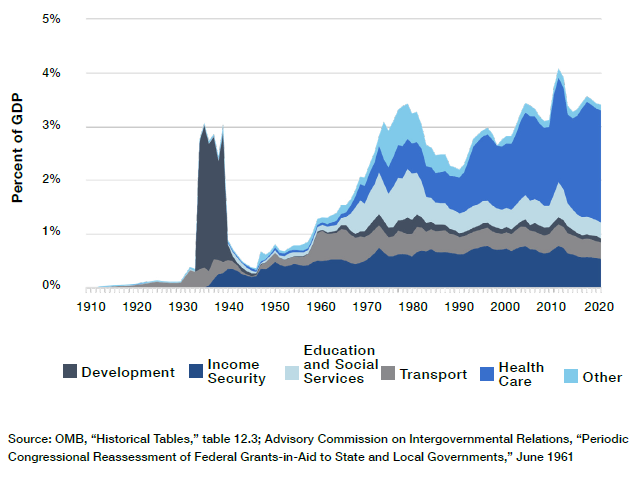
Over the postwar era, state government has grown most. From 1956 to 2019, direct federal spending declined slightly, from 16.6% to 16.4% of GDP, with increased domestic entitlement expenditures only offsetting a great decline in defense spending. Local government spending rose from 6.4% to 9.6% of GDP, while spending by state government soared from 3.5% to 9.1% of GDP (Figure 3). This owed much to the rise of federal grants, which rose from 0.8% to 3.4% of GDP (Figure 4)—of which health care (Medicaid and CHIP) in 2019 accounted for almost two-thirds.[42]
Figure 3
Spending by Layer of Government

Figure 4
Grants to State and Local Government
The Fiscally Fragile Safety Net
Unlike the federal government, lower levels of government cannot print their own currency to finance deficit spending. Indeed, states have traditionally imposed balanced-budget requirements on themselves in order to borrow from bond markets at good rates. That further reduces their ability to rely on income-tax revenues, which are highly cyclical and tend to plummet unpredictably in recessions. In 2009, the majority of states saw revenue fall 10% below forecast levels.[43]
Though states have recently sought to protect themselves from the business cycle by accumulating savings during economic expansions, the median state in 2019 had less than 8% of annual spending in its rainy-day fund. These reserves ranged from Wyoming, which had saved for more than a year’s expenditure, to Illinois, which saved nothing at all.[44]
The need for state and local governments to raise taxes to balance budgets in recessions often conflicts with federal attempts to revive the economy with expansionary fiscal policy. This was true during the Great Depression, and the great increase in federal aid to states provided in the name of Keynesian economics has done remarkably little to change the situation.[45] Expansionary federal fiscal policy is still undermined at the state level. Whereas federal revenues fell by 13% during the subprime recession from 2006 to 2009, state and local own-source revenues increased by 9%.[46]
At the same time, economic downturns tend to greatly increase the numbers of residents who are out of work or have low incomes—increasing the cost of safety-net programs. Just as income taxes account for the bulk of cyclical volatility in state revenues, so Medicaid and unemployment assistance account for much of the year-on-year volatility in their expenditures (Figure 5).
Figure 5
State-Level Expenditure, Percentage Change from Previous Year

In fact, joint state-federal programs are disproportionately exposed to the business cycle. Whereas purely federal entitlement spending is dominated by Medicare and Social Security programs for retirees and the disabled, states are involved in the administration of Medicaid and unemployment assistance—whose working-age caseloads increase rapidly as unemployment rates increase. In 2019, purely federal programs made $2.4 trillion in payments to individuals; in 2021, spending on those programs increased to $2.8 trillion. By contrast, federal spending on joint state-federal entitlement programs almost doubled, from $0.7 trillion to $1.3 trillion (Figure 6).
Figure 6
Federal Entitlement Spending by State Involvement

In most years, states deposit a combination of state and federal payroll taxes in a trust fund to pay unemployment assistance claims.[47] States administer the program and set eligibility and benefit levels under federal oversight. The Department of Labor estimated that $27 billion was to be spent on unemployment benefits in 2020, with state unemployment taxes providing 84% of the associated $46 billion in expected revenues.[48]
In February 2020, states varied in the extent to which they had adequately funded unemployment-insurance trust funds—with 31 states setting aside the full amount recommended for a downturn, while New York had vested only 36% and California 21% of the funds recommended.[49] But as Covid-19 swept across the country, and the number of Americans claiming unemployment assistance soared from 1.7 million in early March 2020 to 24.9 million in mid-May, reserves everywhere were depleted. As a result, Congress enacted a major expansion of benefits and federal funding, spending $472 billion on the program in 2020.[50]
Even though the permanent unemployment assistance entitlement is intended specifically to protect workers from the effect of economic downturns, Congress provided additional funds to bail out the program on an ad hoc basis in 1958, 1961, 1971, 1974, 1982, 1991, 2002, 2008, and 2020—nine of the last 10 recessions.[51]
States similarly manage three major programs to subsidize health care for low-income Americans: Medicaid, for which they can claim between $1 and $9 from the federal government for every $1 they spend on medical services for those eligible for the program; CHIP, for which they are allocated capped allotments by the federal government; and the health-care exchanges, on which they regulate the sale of insurance plans tied to federal subsidies for working Americans without employer-sponsored insurance.
Enrollment in Medicaid and CHIP leaped from 71 million in January 2020 to 81 million a year later.[52] Because federal Medicaid matching funds do not expand unless states can find more of their own money to put up—and CHIP’s fixed grants don’t expand at all—Congress again felt pressed to bail out the states by increasing the share of Medicaid costs assumed by the federal government. From 2019 to 2020, federal spending on Medicaid increased from $387 billion to $460 billion, while the state contribution fell from $227 billion to $211 billion.[53] Four ad hoc bailouts of Medicaid have been provided in the last three recessions—previously in 2001, 2003, and 2009.[54]
Institutionalized Cost-Shifting
As the federal government becomes involved in funding state governments with grants, voters increasingly hold it responsible for outcomes. As a result, states become more confident that they will receive federal aid to bail them out in the event of cost overruns or a fiscal crisis.[55]
Lower levels of government have tended to use federal grants to inflate expenditures, rather than to reduce their own taxes.[56] Intergovernmental grants drive a wedge between the costs and benefits of additional spending, which leads states to incur expenditures that they would not deem worthwhile if they had to bear the full costs themselves.[57] This inflates government spending by giving subnational governments the opportunity to shift the cost of expenditures to nonresident taxpayers.[58]
With so many overlapping programs, states can pick and choose those offering the most generous terms.[59] Medicaid, which generally offers between $1 and $3 of federal funds for every $1 that states spend on a wide range of services, without limit, has proved to be particularly attractive. From 1977 to 2019, the program increased steadily from 2% to 29% of state general expenditure.[60]
Medicaid enrollment and expenditures have risen through a ratchet effect associated with the business cycle.[61] During economic expansions, states use rising tax revenues and falling caseloads to expand eligibility; during recessions, they successfully demand bailout assistance from the federal government.[62] Even absent this dynamic, expenditures to cover existing enrollees would rise automatically as health-care capabilities and costs increase over time. The Congressional Budget Office estimates that Medicaid spending will increase by 78% over the coming decade, even without any further expansion of benefits or eligibility.[63]
States have also sought to exploit Medicaid to ameliorate their general fiscal situation at the expense of federal taxpayers. They have, for instance, used the overpayment for medical services provided to schoolchildren to shift education expenses to the federal government.[64] All 50 states tax medical providers for the purpose of increasing the Medicaid costs for which they can claim reimbursement from the federal government, subsequently compensating hospitals for participating in the scam.[65] New York was able to generate a $15 billion windfall from the federal government over 20 years by getting its Medicaid program to pay $5,000 per day for individuals with developmental disabilities at state institutions.[66]
When Congress capped the average rates at which states could receive reimbursement for hospital services, states responded by concentrating overpayments at favored (typically state-owned) facilities.[67] One state proposed to pay publicly owned nursing homes 12 times the standard reimbursement amount.[68] State claims nonetheless still well exceed permitted limits, which are weakly enforced by the federal government.[69]
When hospitals serving disproportionately poor communities were exempt from payment caps, claims for supplemental payments at those facilities surged from $0.5 billion to $19 billion within two years, as this trick caught on and states rushed to take advantage.[70] New Hampshire used revenue from supplemental payments to fund its judicial system, highway program, and other general expenditures, as the state overpaid for care in return for “donations” to the state budget.[71] These payments were eventually restricted by Congress, though with existing overpayments grandfathered—entrenching a windfall for states that had most abused the system.
One study estimated that if intergovernmental transfers, certified public expenditures, state transfers, and provider taxes were excluded from state Medicaid contributions, the states’ share of Medicaid supplemental payments for 2005 would have declined from 43% to 13%. In other words, states received an average of $7.35 from the federal government for every $1 they raised from general taxation, rather than the $2.31 for every $1 that appears on the books.[72] The official state share of overall Medicare expenditures has since fallen significantly further.[73]
Inflated volumes are even harder to police than inflated fees. Medicaid fraud often goes unpunished.[74] The federal government can, in theory, withhold matching funds from states that claim payments to which they are not entitled, but it lacks the manpower to scrutinize millions of claims and can exercise only loose oversight. States, however, stand to lose several dollars in federal revenue for every dollar that they spend reducing waste, fraud, and abuse—so they have little incentive to do so. In 2020, the federal government estimated that 21% of federal Medicaid payments, worth $86 billion, were improperly claimed.[75]
The enormous complexity of the Medicaid program—which involves many thousands of providers across 50 states receiving reimbursement through complex payment schemes under a vast array of different eligibility rules—makes abuse very difficult to identify and the overall efficiency of the program nearly impossible to assess.[76] The federal government lacks timely, accurate, and complete data needed for oversight, or the political autonomy to sanction states that fail to comply.[77]
A federal official once testified: “Some fund transfers and financing mechanisms are designed solely to maximize Federal reimbursements to States and serve to obfuscate the source and final use of both Federal and State funds.”[78] If a state seeks to inflate its federal Medicaid revenues by developing an elaborate scheme to hide kickbacks for hospitals through a web of formal reimbursement, indirect payments, tax preferences, managed-care rules, and favorable regulatory provisions, it is nearly impossible for the federal government to prevent it.
The multiplicity of federal grant programs has also encouraged states to exploit the interaction between them. For instance, because the federal government will pay 100% of health-insurance premiums for low-income workers enrolled in ACA’s exchange, some states have declined to expand Medicaid to them, where they would be responsible for 10% of the cost.[79] States have already exploited this arrangement with regulations to push up the insurance benchmarks on which federal subsidies for their residents to buy plans are based—a practice known as “silver-loading.”[80] Some consultants have suggested that states could reap a windfall by taking this practice to its logical extreme.[81] Premiums for health insurance purchased by individuals vary much more between states than do those for employer-sponsored insurance, for which federal regulations preempt state laws.[82]
Prior to welfare reform, AFDC recipients were automatically eligible for food stamps and Medicaid, and enrollment in those programs was often administered jointly. States paid for roughly 40% of AFDC benefits, while the fully federal food stamp benefits are reduced by $0.30 for every $1 increase in household incomes (including state-funded benefits). States thus stood to lose much of the money they spent expanding AFDC in cuts to food stamps. States therefore restrained AFDC expenditures, while greatly increasing spending on Medicaid, which did not induce a similar reduction in federal food stamp payments.[83]
The 1996 welfare reform replaced AFDC’s matching funds with TANF (Temporary Assistance for Needy Families) block grants, with the intention of allowing states more flexibility to improve outcomes, by using funds for child care, work training, or teen pregnancy prevention, instead of simply providing cash payments. But in practice, this has served mostly to make it easier for states to use federal TANF funds to pay for extraneous state responsibilities, while structuring aid to the poor to increase their eligibility for fully federally funded means-tested assistance.[84]
This has been clearest in the case of SNAP (food stamps), where the federal government pays 100% of program costs, but states have been able to manipulate eligibility to bypass standard asset tests and time limits. Half of SNAP beneficiaries are now enrolled because of “broad-based categorical eligibility,” whereby TANF funds are used to send residents a nominal benefit (often merely a pamphlet), and this status as TANF beneficiaries qualifies them for food stamps.[85] From 2001 to 2017, the number of Americans receiving SNAP benefits increased from 17 million to 42 million, while annual program costs soared from $18 billion to $68 billion—dwarfing the $21 billion TANF block grant.[86] States have similarly sought to push welfare costs to the federal government by shifting beneficiaries to the Supplemental Security Income program.[87]
Aid Gone Awry
In a 1995 report for the World Bank, economist Rémy Prud’homme argued that “decentralized redistribution is self-defeating.”[88] It inhibits the distribution of taxes and benefits according to need, as those most able to pay and those who most need assistance will often live in different jurisdictions. As a result, benefits become inflated for those with lesser needs, while there is less funding available for those facing the greatest hardship.
Fiscal decentralization also makes it harder to concentrate the tax burden on the rich, by making taxes easier to evade. Raising state taxes on the most highly compensated residents appears to push them out of state, without increasing net redistribution.[89] While the richest 20% of Americans pay 70% of federal taxes, state and local governments rely largely on property and sales taxes, which are much more broadly distributed.[90] As a result, the burden of state and local taxes on the poorest quintile of Americans is almost as heavy as that on the rich, and greater than the federal tax burden that the poor bear (Figure 7).
Figure 7
Average Federal and State/Local taxes by Income Quintile, 2004

States with the least productive economies tend to have the highest poverty rates, so they need to spend more to assure the same basic standard of living to residents. But they also have lower wage rates and smaller pools of concentrated wealth, which means that they will raise substantially less revenue than richer states with the same tax rates. In 2019, Mississippi collected a higher share of personal income in state and local taxes (10.2%) than Massachusetts (9.9%), but this generated much less revenue per capita ($3,949 vs. $7.339).[91]
As a result, poorer states are much less able to finance benefits for the needy with taxes limited to the rich.[92] States whose residents have the greatest levels of unmet needs will therefore tend to provide the least aid to them. The more states are responsible for financing aid to the needy, the greater the disparity between wealthier and poorer states.[93]
Medicaid was originally designed to provide $3 in federal funds for every $1 that the poorest states spend on covered benefits, compared with only $1 in federal aid for every $1 that the wealthiest states spend.[94] As a result, poorer states receive slightly more federal aid for providing mandatory Medicaid benefits to the program’s mandatory eligibility groups. But because there is no upper limit on federal aid, most Medicaid spending goes on optional benefits and eligibility groups—and the wealthiest states, which can put up the most money, receive the most assistance (Figure 8).[95]
Figure 8
Federal Medicaid Funding by State

Medicaid spending growth has increasingly served to displace private insurance, rather than being well targeted to fill gaps in health-insurance coverage. From 1978 to 2018, as the share of the population under age 65 enrolled in Medicaid increased from 7% to 20%, the proportion of uninsured fell only from 12% to 11%.[96] Part of this increase has served to fill in gaps that have arisen from the rising cost of private insurance, but as Congress expanded eligibility in the late 1990s, scholars estimated that 60% of those newly covered previously had private insurance.[97] Despite $596 billion being spent on Medicaid in 2018, and health-care payments to states that exceed those that Canada’s national government provides to its provinces, 30 million Americans still lacked health-insurance coverage.[98]
In particular, this arrangement has allowed wealthier states to expand eligibility to Medicaid’s Long-Term Care (LTC) benefits to the middle class. While states are required by federal law to recover LTC costs from the estates of individuals who have used the program’s nursing-home services, the structure of matching funds offers them little incentive to collect payments, and only 0.4% of LTC costs are recovered.[99] Federal matching aid for state spending on LTC is especially inappropriate, given how many people retire to another state: in 2016, New York received $15.5 billion in federal Medicaid funds for LTC, while Florida received only $6.2 billion—even though Florida’s senior population was a third larger.[100]
Proposals to require a federal floor on OAA and Aid to Dependent Children benefits in the Social Security Act of 1935 had been obstructed by Southern Democrats, led by Senator Harry Byrd of Virginia.[101] As a result, the variation in matching grants to states for cash payments to the poor was not constrained by mandatory expenditures, as it has been in Medicaid.[102]
By 1969, OAA was paying beneficiaries $139 per month in Wisconsin but only $40 per month in Mississippi.[103] Three years later, Congress replaced OAA, Aid to the Blind, and Aid to the Disabled, with SSI—a flat benefit of $130 per month, funded entirely by the federal government, indexed to increase automatically with the cost of living.[104] The poverty rate among seniors plummeted from 23% in 1970 to 15% in 1974.[105]
But disparities subsequently further widened under AFDC. As inflation and welfare enrollment soared during the 1970s, states with the weakest fiscal capacity slashed real AFDC benefit levels to keep program budgets constant. To secure the enactment of the 1996 welfare reform legislation, TANF block grants to states were based on historical matching funds that states had previously claimed under AFDC, so enormous disparities in allocations to states were fixed in stone.[106] Federal TANF grants in 2020 ranged from $3,876 per child under the poverty line in the District of Columbia, to $276 in Mississippi.[107] The differences between states are so great that it barely makes sense to talk about TANF as a single program.
Federal law pushes states toward some degree of uniformity in unemployment taxes, by imposing a 6% payroll tax on the first $7,000 that employers pay each worker, from which firms can deduct 90% of the amount they contribute to state programs.[108] But, as this mandatory regressive tax has been substantially eroded by inflation over recent decades, disparities in spending have been increased by differences in tax bases from which states can draw to supplement it. As a result, average weekly benefits in New Jersey ($518) greatly exceed those in poorer states like West Virginia ($207), even though their unemployment taxes take a smaller share of wage income (0.73% vs. 0.76%).[109] Whereas 58% of unemployed workers in New Jersey received benefits, only 28% of those in West Virginia did so.[110]
When the CARES Act established a federally funded uniform $600-per-week Pandemic Unemployment Compensation benefit to supplement traditional unemployment programs, it relied on state unemployment systems only to distribute the funds. This sufficed to turn implementation into a fiasco, with some states unable to process claims because of 40-year-old computer systems.[111] Two months after the CARES Act, a third of unemployment benefits had still not been paid.[112]
Untangling the Safety Net
For decades, spending on joint federal-state entitlements has ballooned, with little attention to cost-effectiveness or the distribution of need. Any proposal to slow the growth of expenditures faces opposition from state officials and individuals who are adversely affected.
Republicans have long sought to limit the incentive for states to inflate expenditures in pursuit of federal matching funds by reestablishing caps on grants to states for welfare and medical benefits. The 1996 welfare reform succeeded in doing this for welfare, by turning AFDC matching payments into TANF block grants; but proposals to do likewise for Medicaid have repeatedly met resistance.[113] Opponents feared that block grants would lead to the erosion of individual entitlements to health care, as medical costs increased over time, shifting risks to states and leaving them potentially more exposed in recessions.[114] Capping allotments would only increase, rather than reduce, the pressure to bail out entitlement programs during recessions.
As political scientist Michael Greve has pointed out, fully federal programs, such as Medicare or SSI, “work with comparatively high accuracy and low administrative overhead,” while “intergovernmental fiscal arrangements entail high transaction and monitoring costs, as well as principal-agent problems that have no clean solution.”[115] State involvement in managing federal entitlement funds is an artifact of Jim Crow politics of the mid-20th century and serves only to impede targeted and efficient redistribution to those who need assistance.
In the 1982 State of the Union Address, President Reagan proposed federalizing Medicaid, in return for passing responsibility for welfare and food stamps entirely to the states. The states resisted the proposal because of concerns that it would raise their costs in recessions, while Reagan opposed increasing federal spending.[116] The National Governors Association and the National Conference of State Legislatures responded by proposing a federal takeover of welfare benefits and Medicaid, in return for states assuming the full responsibility for financing transportation, education, and law enforcement.[117]
The federal government is best suited to operating entitlements, as it can target benefits to those who are most in need, wherever they live, while limiting taxes to those with the greatest ability to pay.[118] Federally administered entitlements would allow benefits to follow Americans as they move across state lines during the course of their lives, rather than trapping them in places where there are few good jobs available.[119] And unlike states, the federal government can run substantial budget deficits that counteract the effects of the business cycle.
Unifying entitlements at the federal level would greatly reduce the complexity of assessing eligibility for dozens of interacting benefit systems, while reducing the risk that needy individuals fall into unintended gaps between them. This would allow eligibility between programs to be linked, without allowing states to exploit the arrangement to shift costs to federal taxpayers. By facilitating the integration of tax and benefit systems, it could allow the modernization of benefits, so that individuals could draw upon entitlements when they most need assistance across their lives—regardless of which states they happen to live in at the time.
As state regulations often inflate the cost of health insurance, along with federal subsidies to purchase it, individuals should be allowed to purchase and renew health-insurance coverage across state lines.[120] The federal government should also entirely fund and administer essential health-care benefits (hospital, physician, prescription drug, and long-term-care services) for Medicaid and CHIP beneficiaries that states are currently mandated to cover, along with Medicare savings programs. Expansions of Medicaid eligibility and benefits beyond this should be funded entirely out of state funds. (For further details on the divide between mandatory and optional Medicaid benefits, see my August 2020 Manhattan Institute report).[121]
This arrangement would give the federal government and states full responsibility and control over expenses that they each, in turn, choose to incur. It would make Medicaid a program focused on providing health-care benefits to Americans who most need assistance, rather than an open-ended opportunity for wealthy states to shift costs to federal taxpayers. It would also allow for long-term-care financing to be properly integrated with incentives to purchase private insurance over the life cycle.
The federal government should also assume full financial and operational responsibility over Unemployment Insurance. This would protect states from fiscal obligations that put their solvency at risk in times of recessions; and it would facilitate a shift away from regressive financing through state payroll taxes, and toward general federal income-tax revenues, which can more easily be limited to the rich. Nationalizing UI would also allow unemployment benefits to be integrated with Social Security’s OASDI benefits, which follow individuals as they move between states at any point in their lives. This could make possible broader reforms, such as allowing individuals to take part of their Social Security benefits at times of greater need during their working careers.[122]
Eligibility for federally funded entitlements, such as SNAP, SSI, or Disability Insurance, should be determined entirely at the federal level. At present, broad-based categorical eligibility criteria for SNAP, along with disability determinations for SSI and DI programs, are made by state officials, even though benefits for the programs are entirely designed and funded by the federal government.
Split state-federal responsibility for entitlements is a vestige of mid-20th-century Jim Crow politics, which serves to inflate costs and reduce benefits for Americans who most need assistance, while increasing the vulnerability of state budgets to the business cycle. To remedy these problems, the federal government should assume full operational, administrative, and financial responsibility for entitlements that depend upon federal funds.
About the Author
Chris Pope is a senior fellow at the Manhattan Institute. Previously, he was director of policy research at West Health, a nonprofit medical research organization; health-policy fellow at the U.S. House Committee on Energy and Commerce; and research manager at the American Enterprise Institute. Pope’s research focuses on health-care payment policy, and he has recently published reports on hospital-market regulation, entitlement design, and insurance-market reform. His work has appeared in, among others, the Wall Street Journal, Health Affairs, U.S. News & World Report, and Politico.
Pope holds a BSc in government and economics from the London School of Economics and an MA and PhD in political science from Washington University in St. Louis.
Endnotes
Are you interested in supporting the Manhattan Institute’s public-interest research and journalism? As a 501(c)(3) nonprofit, donations in support of MI and its scholars’ work are fully tax-deductible as provided by law (EIN #13-2912529).